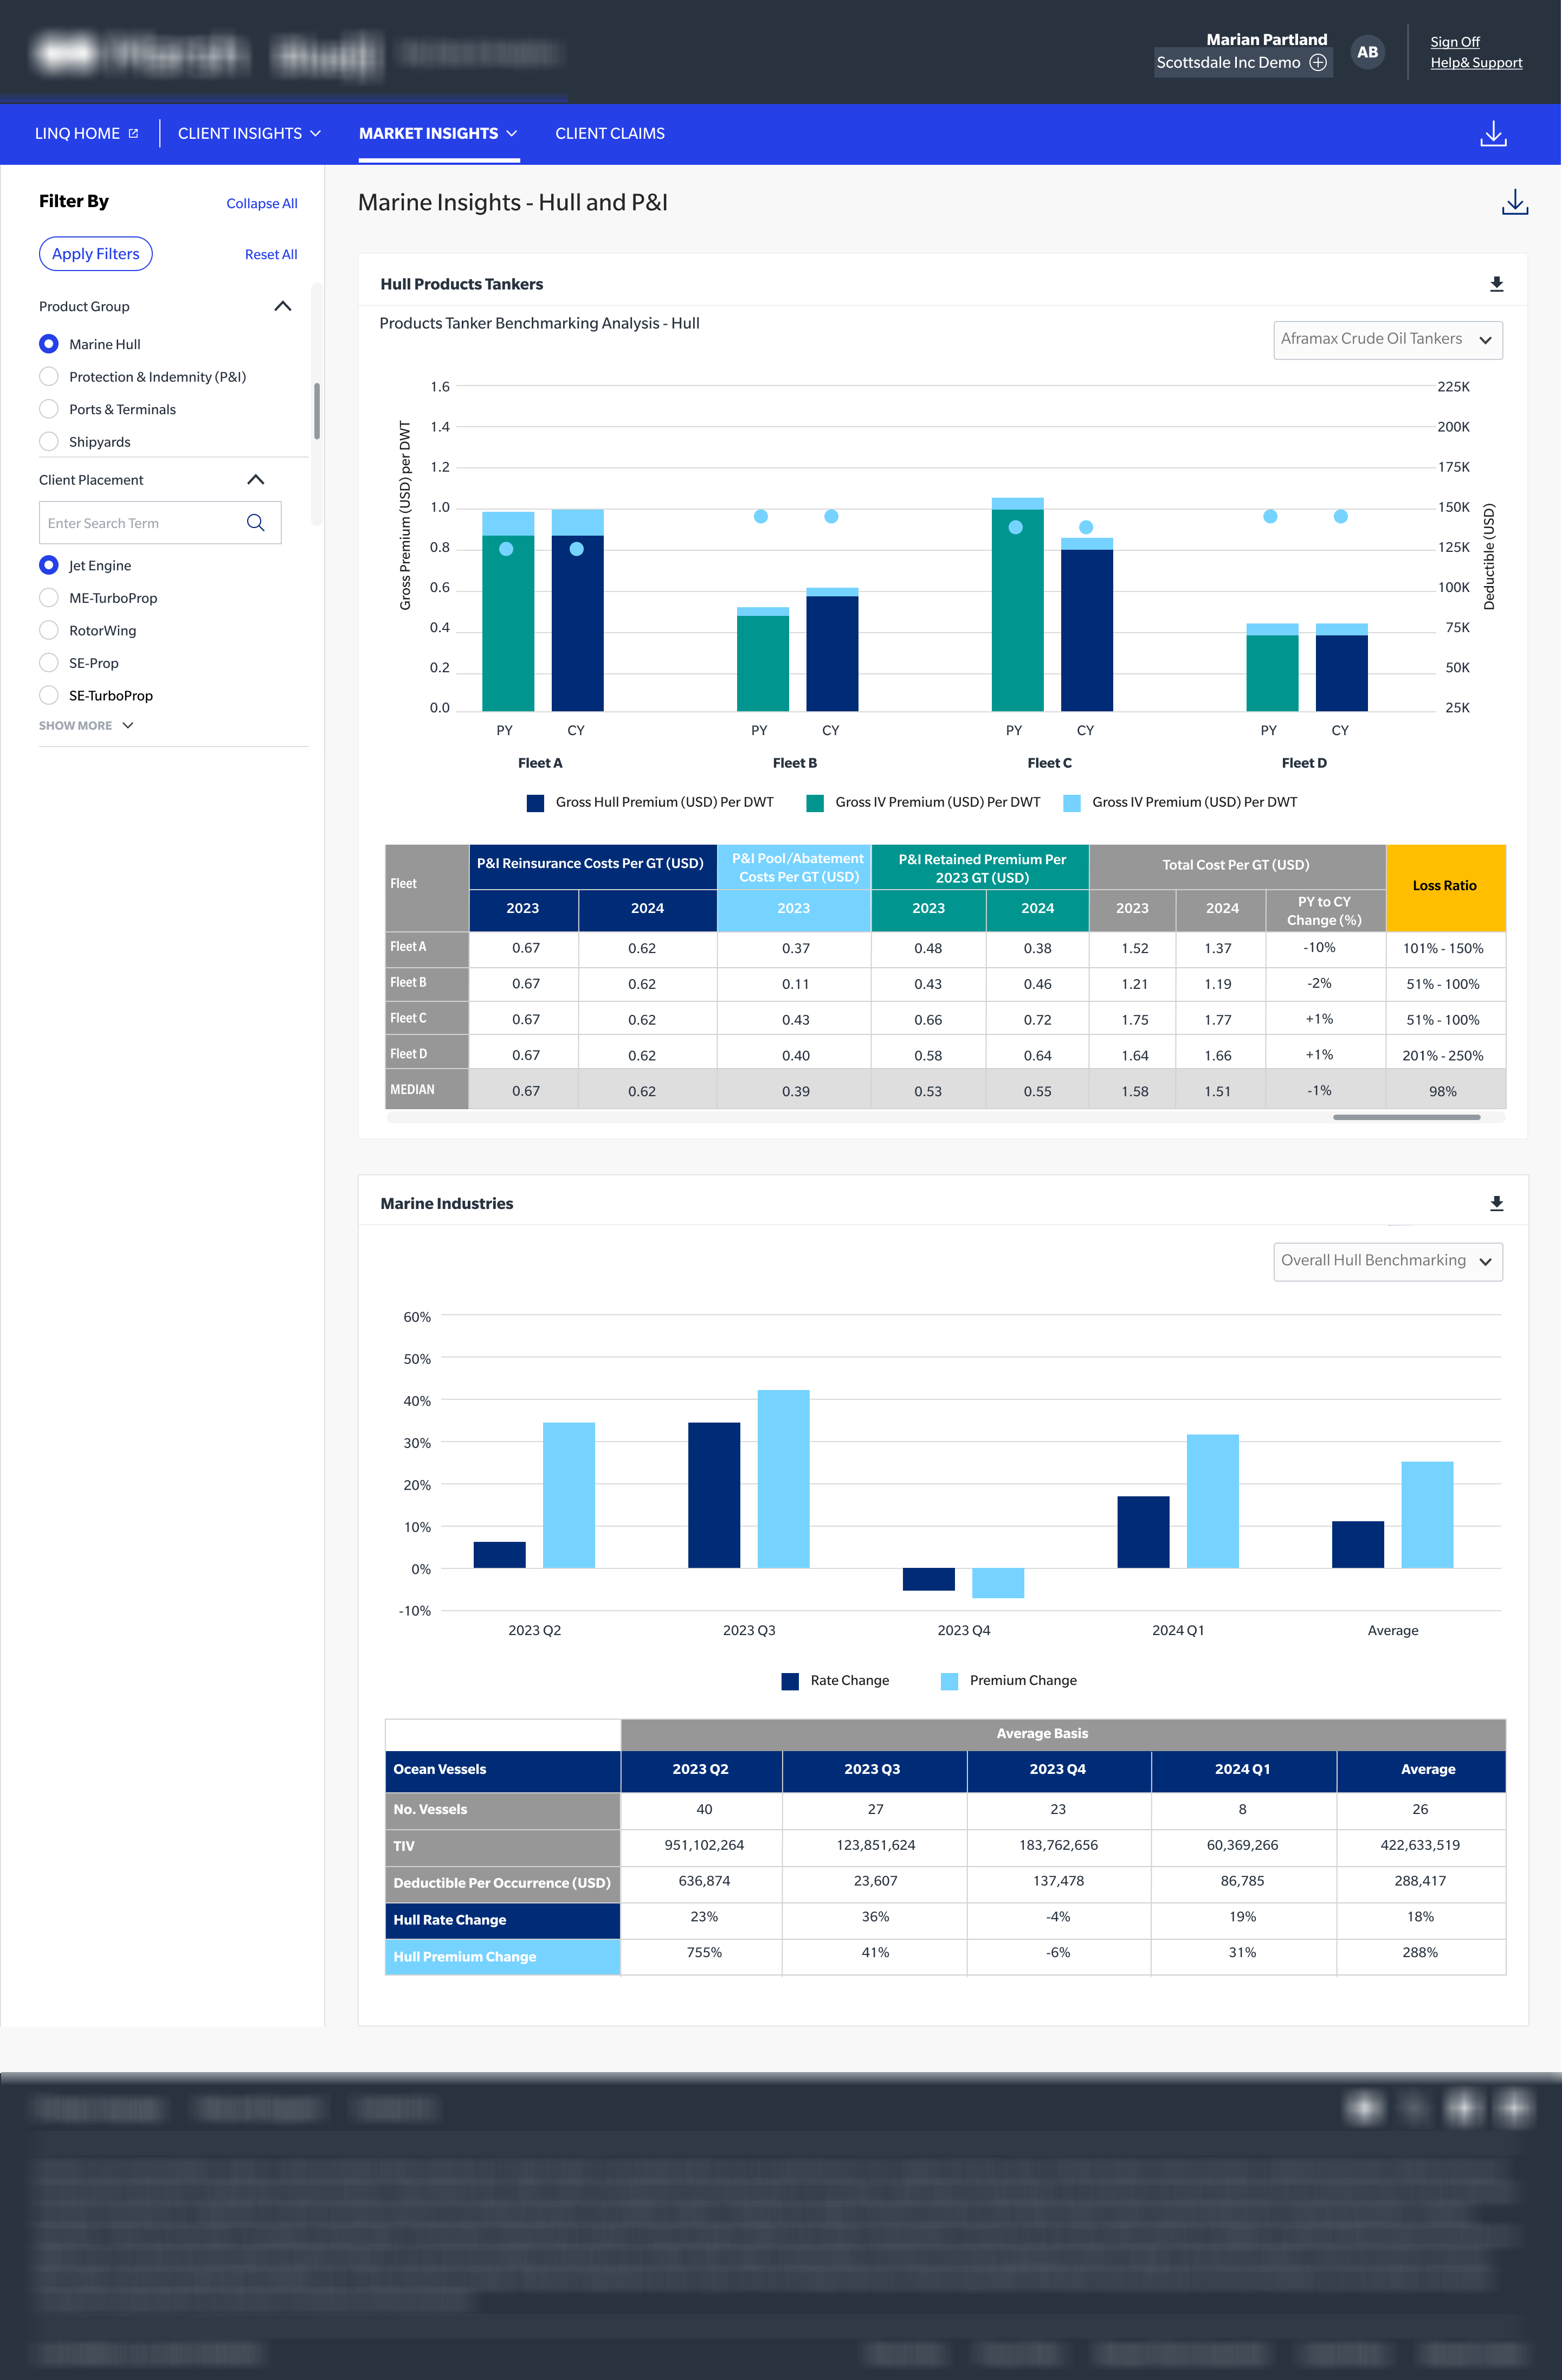
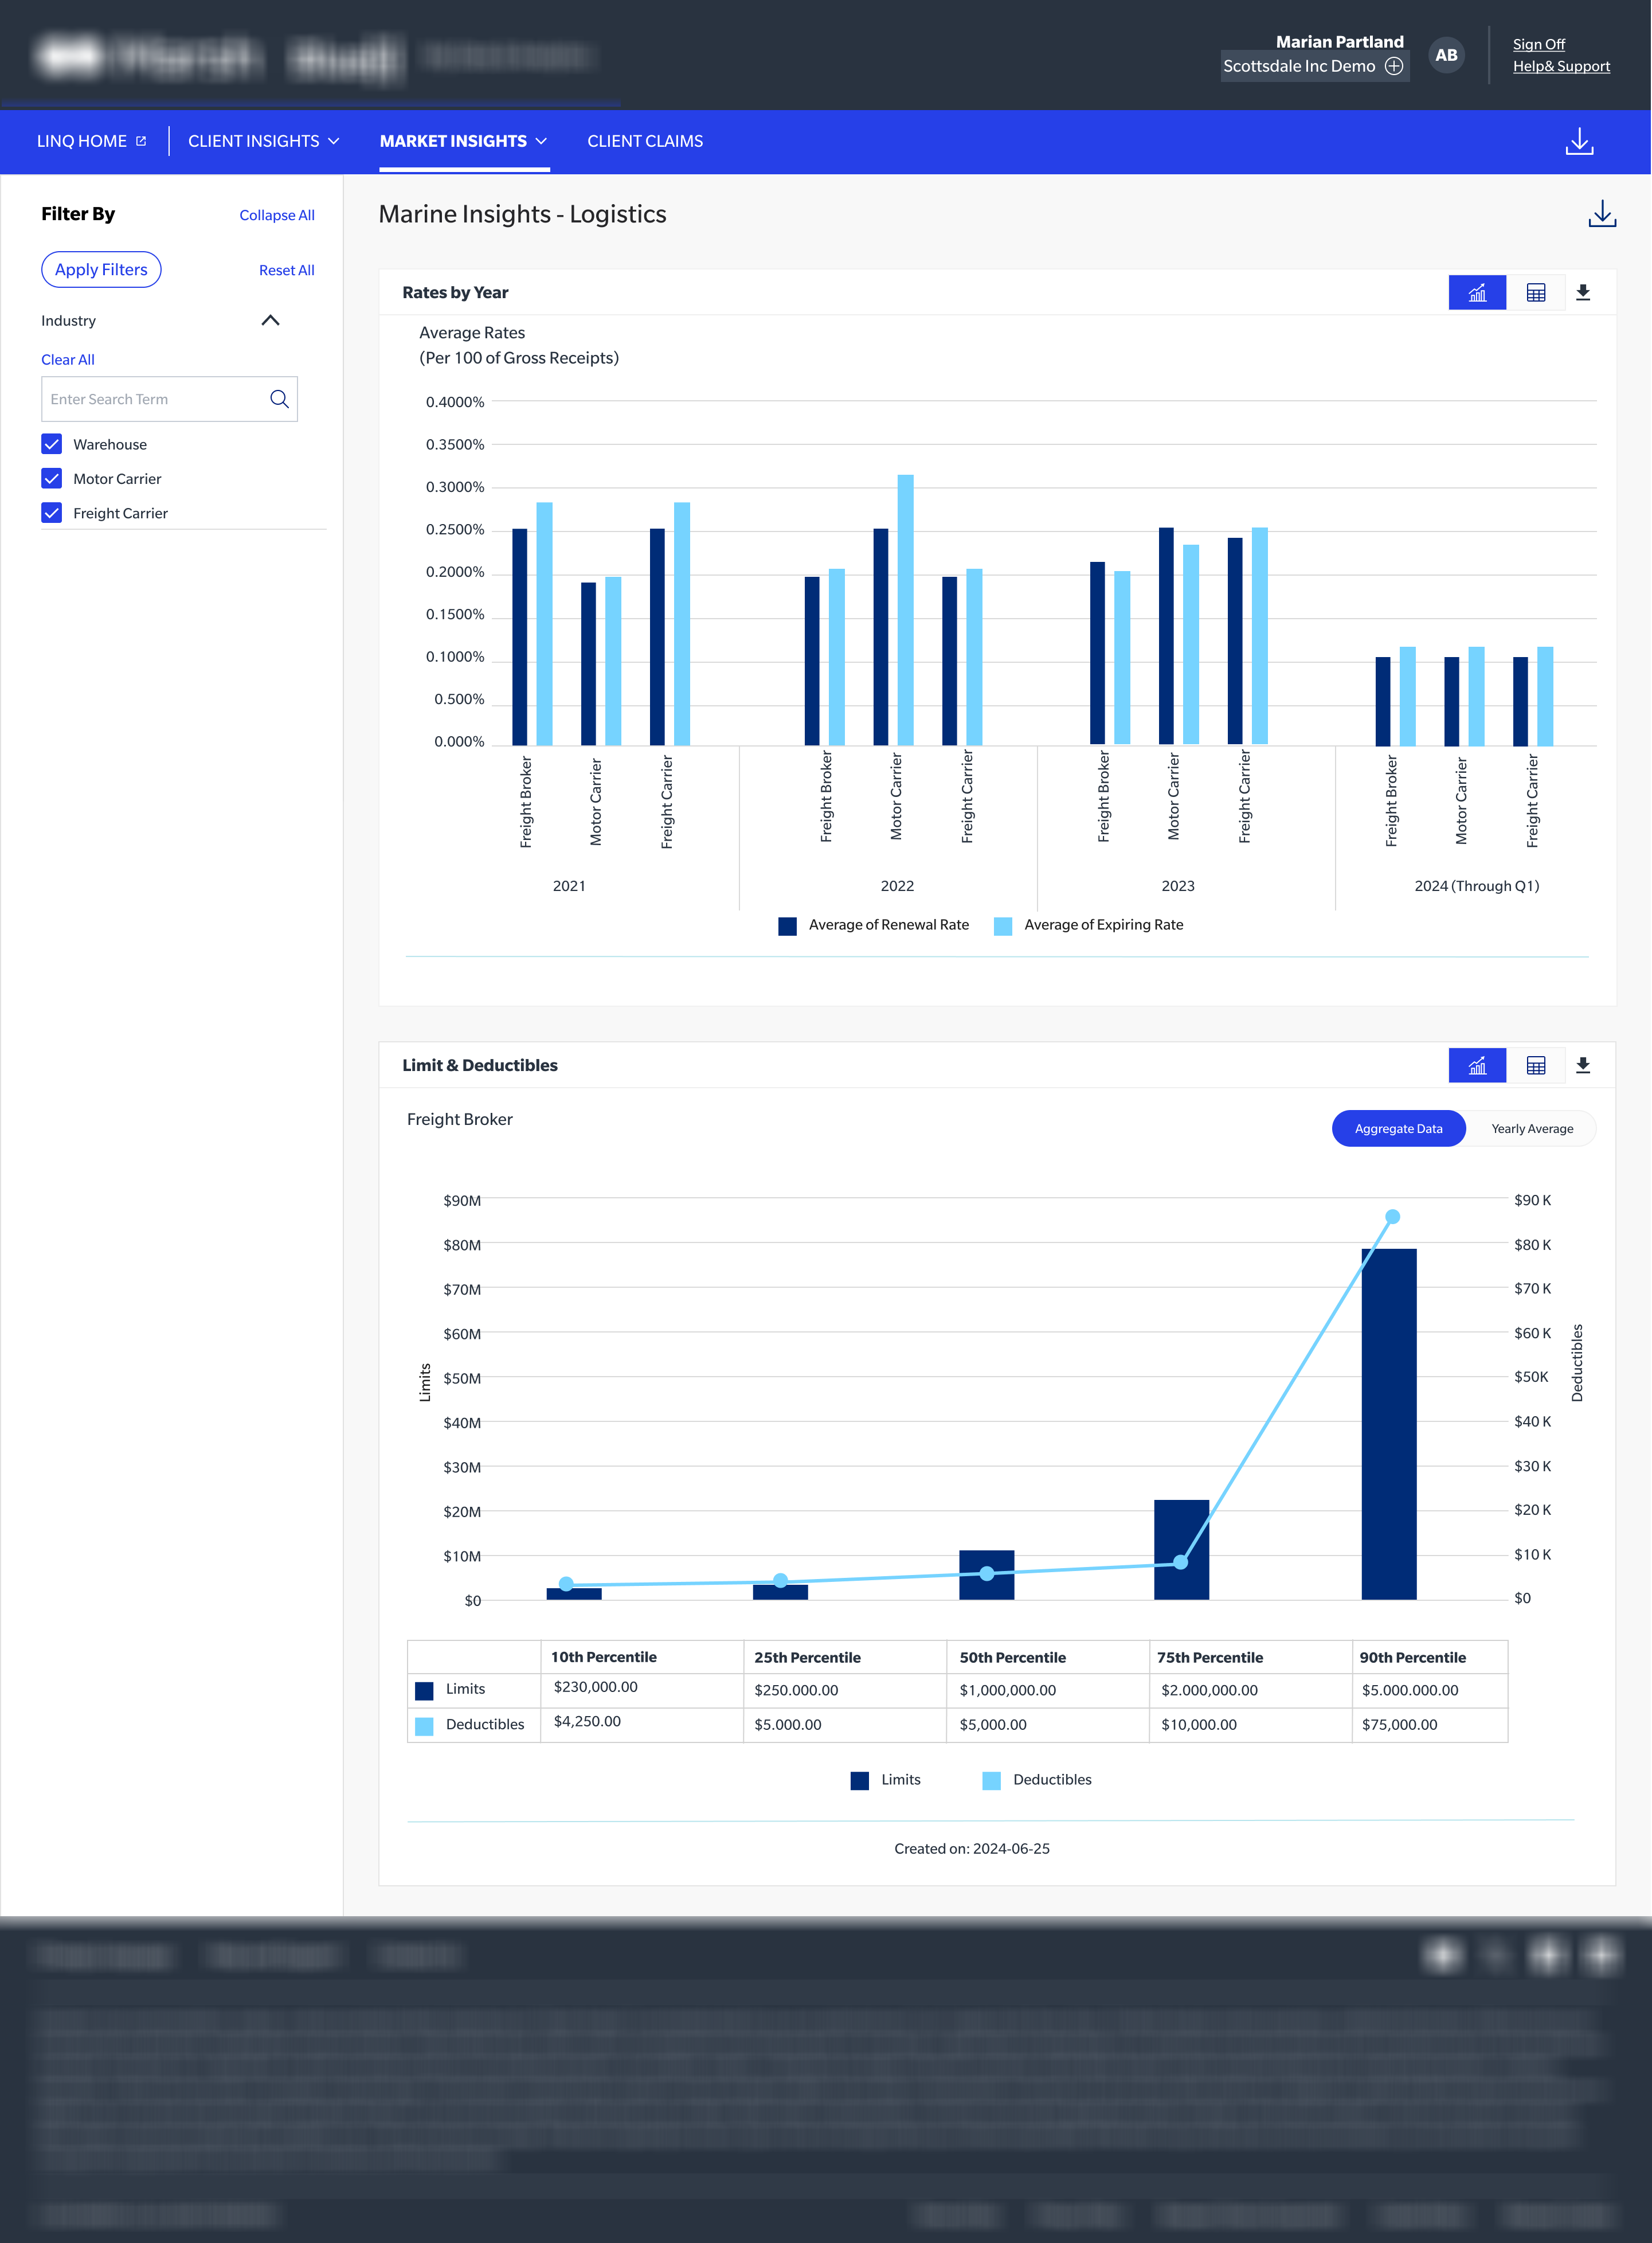
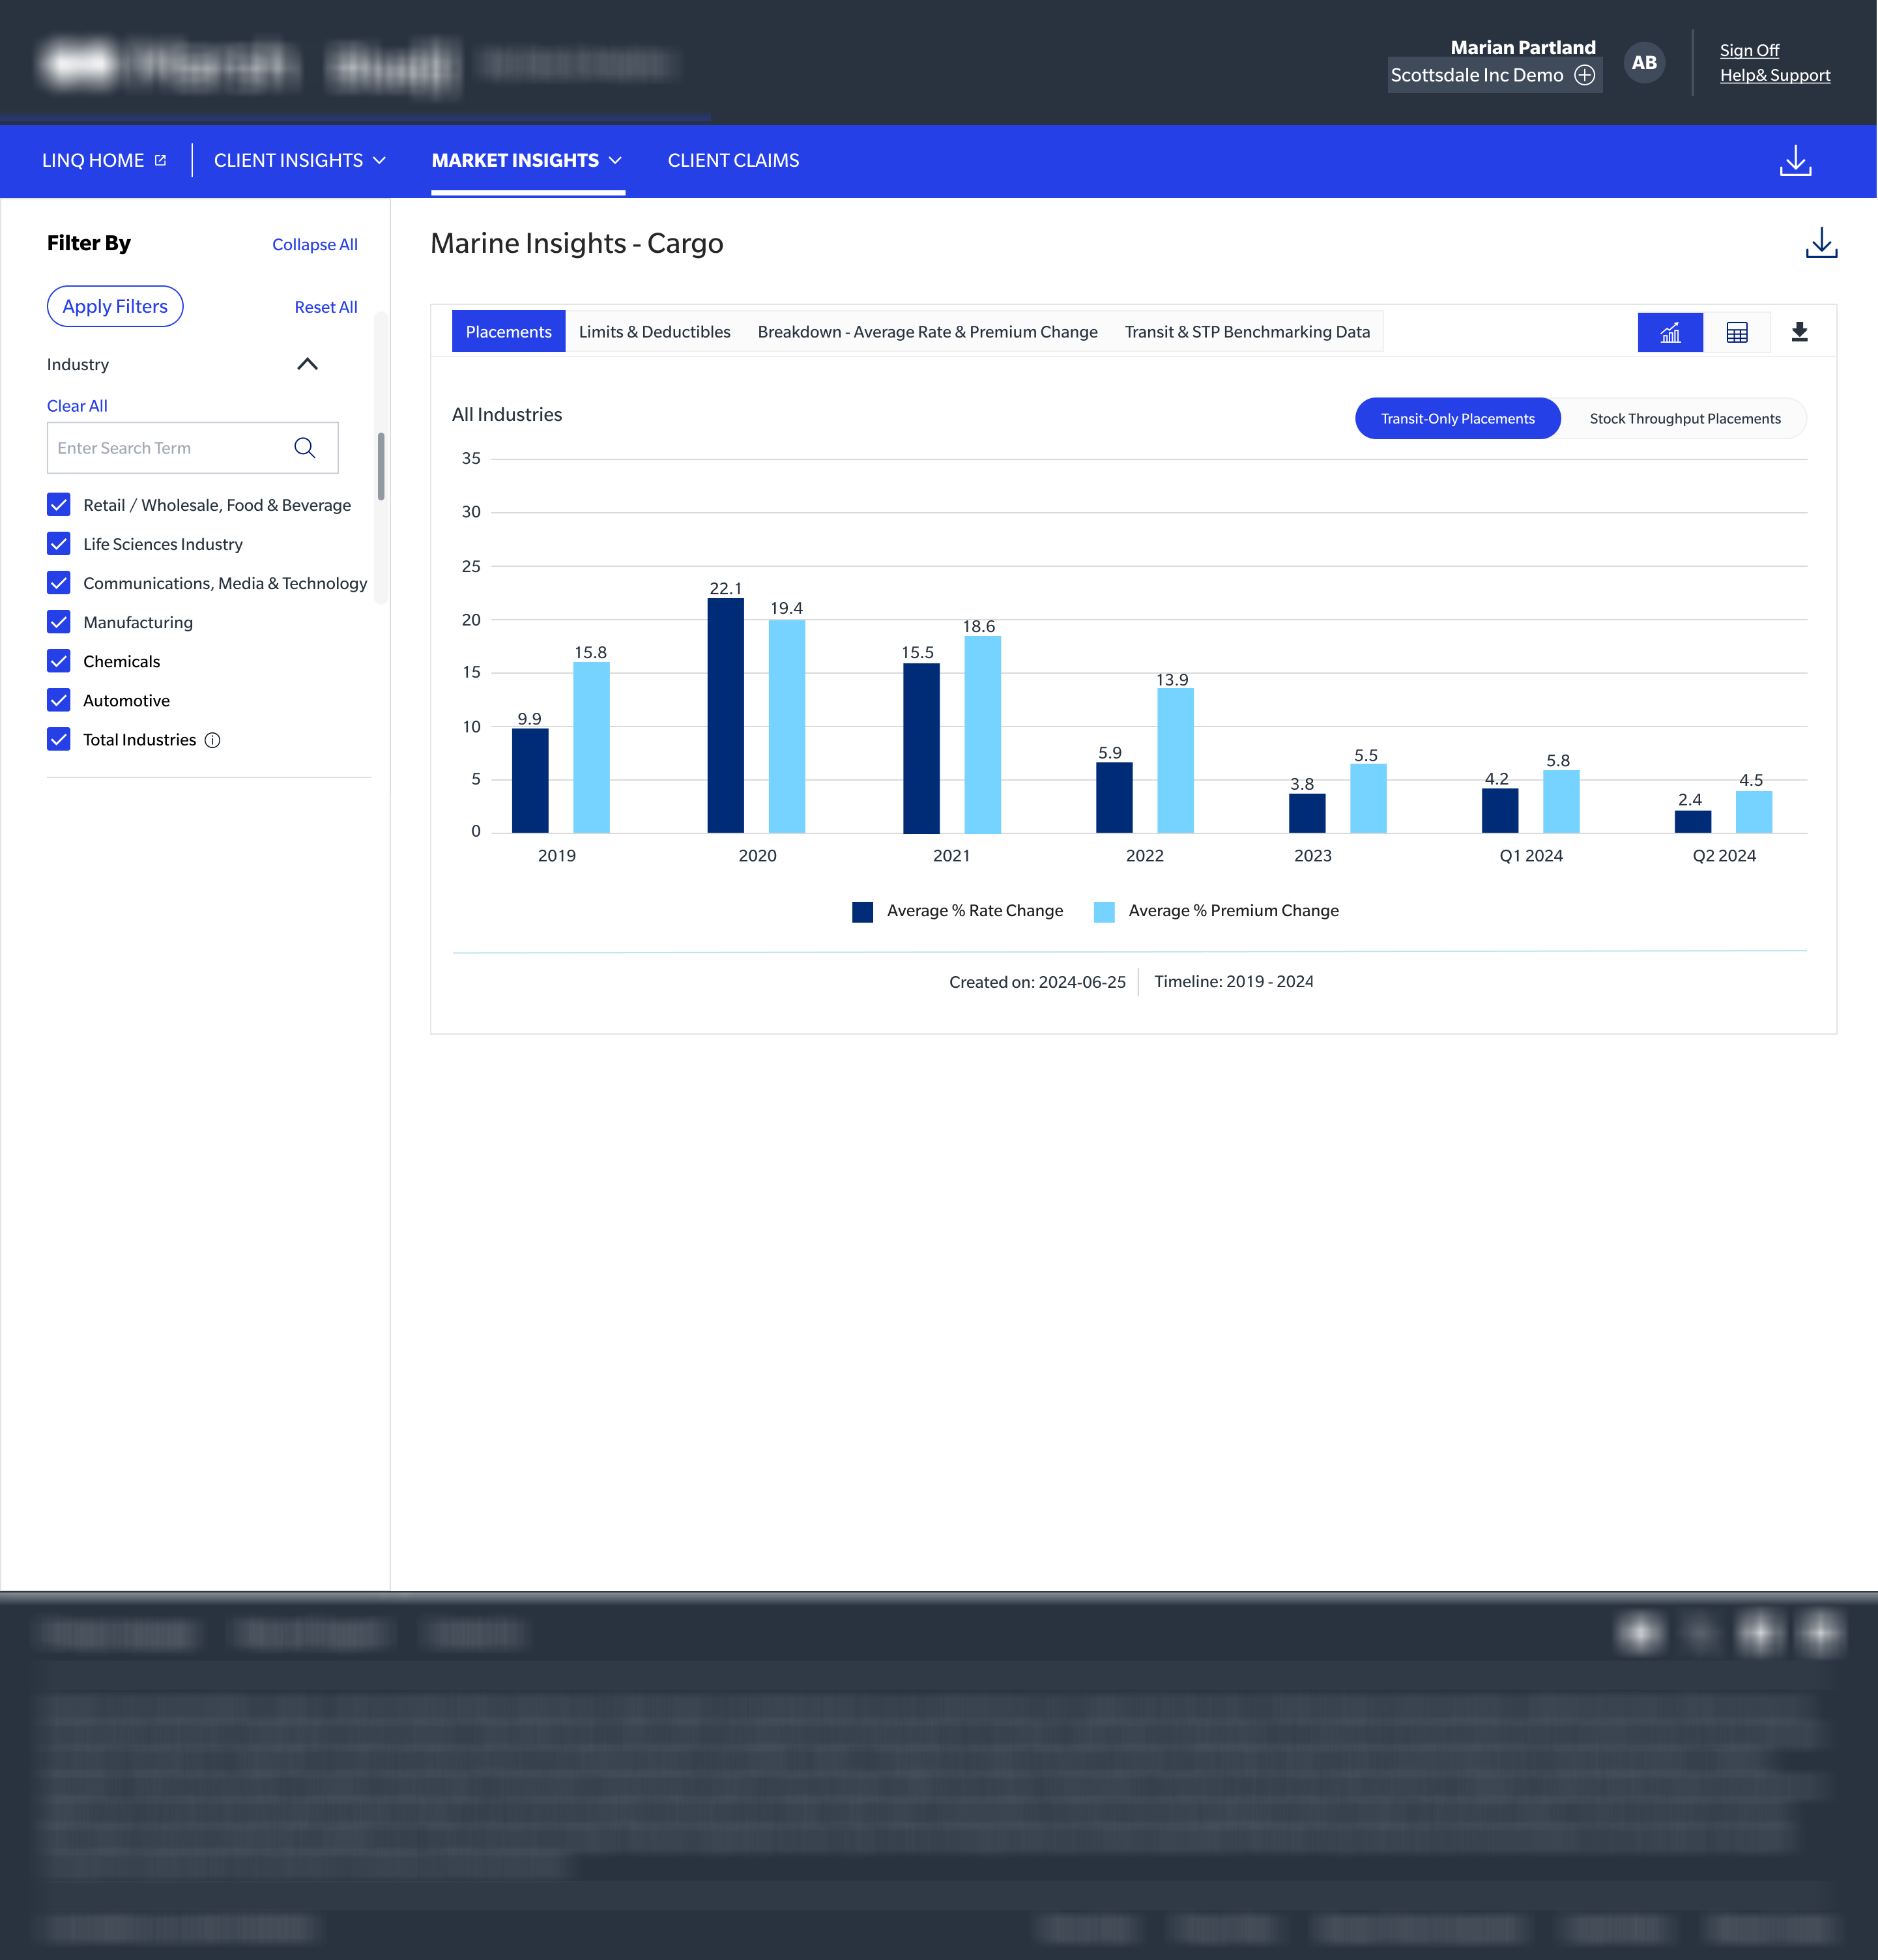
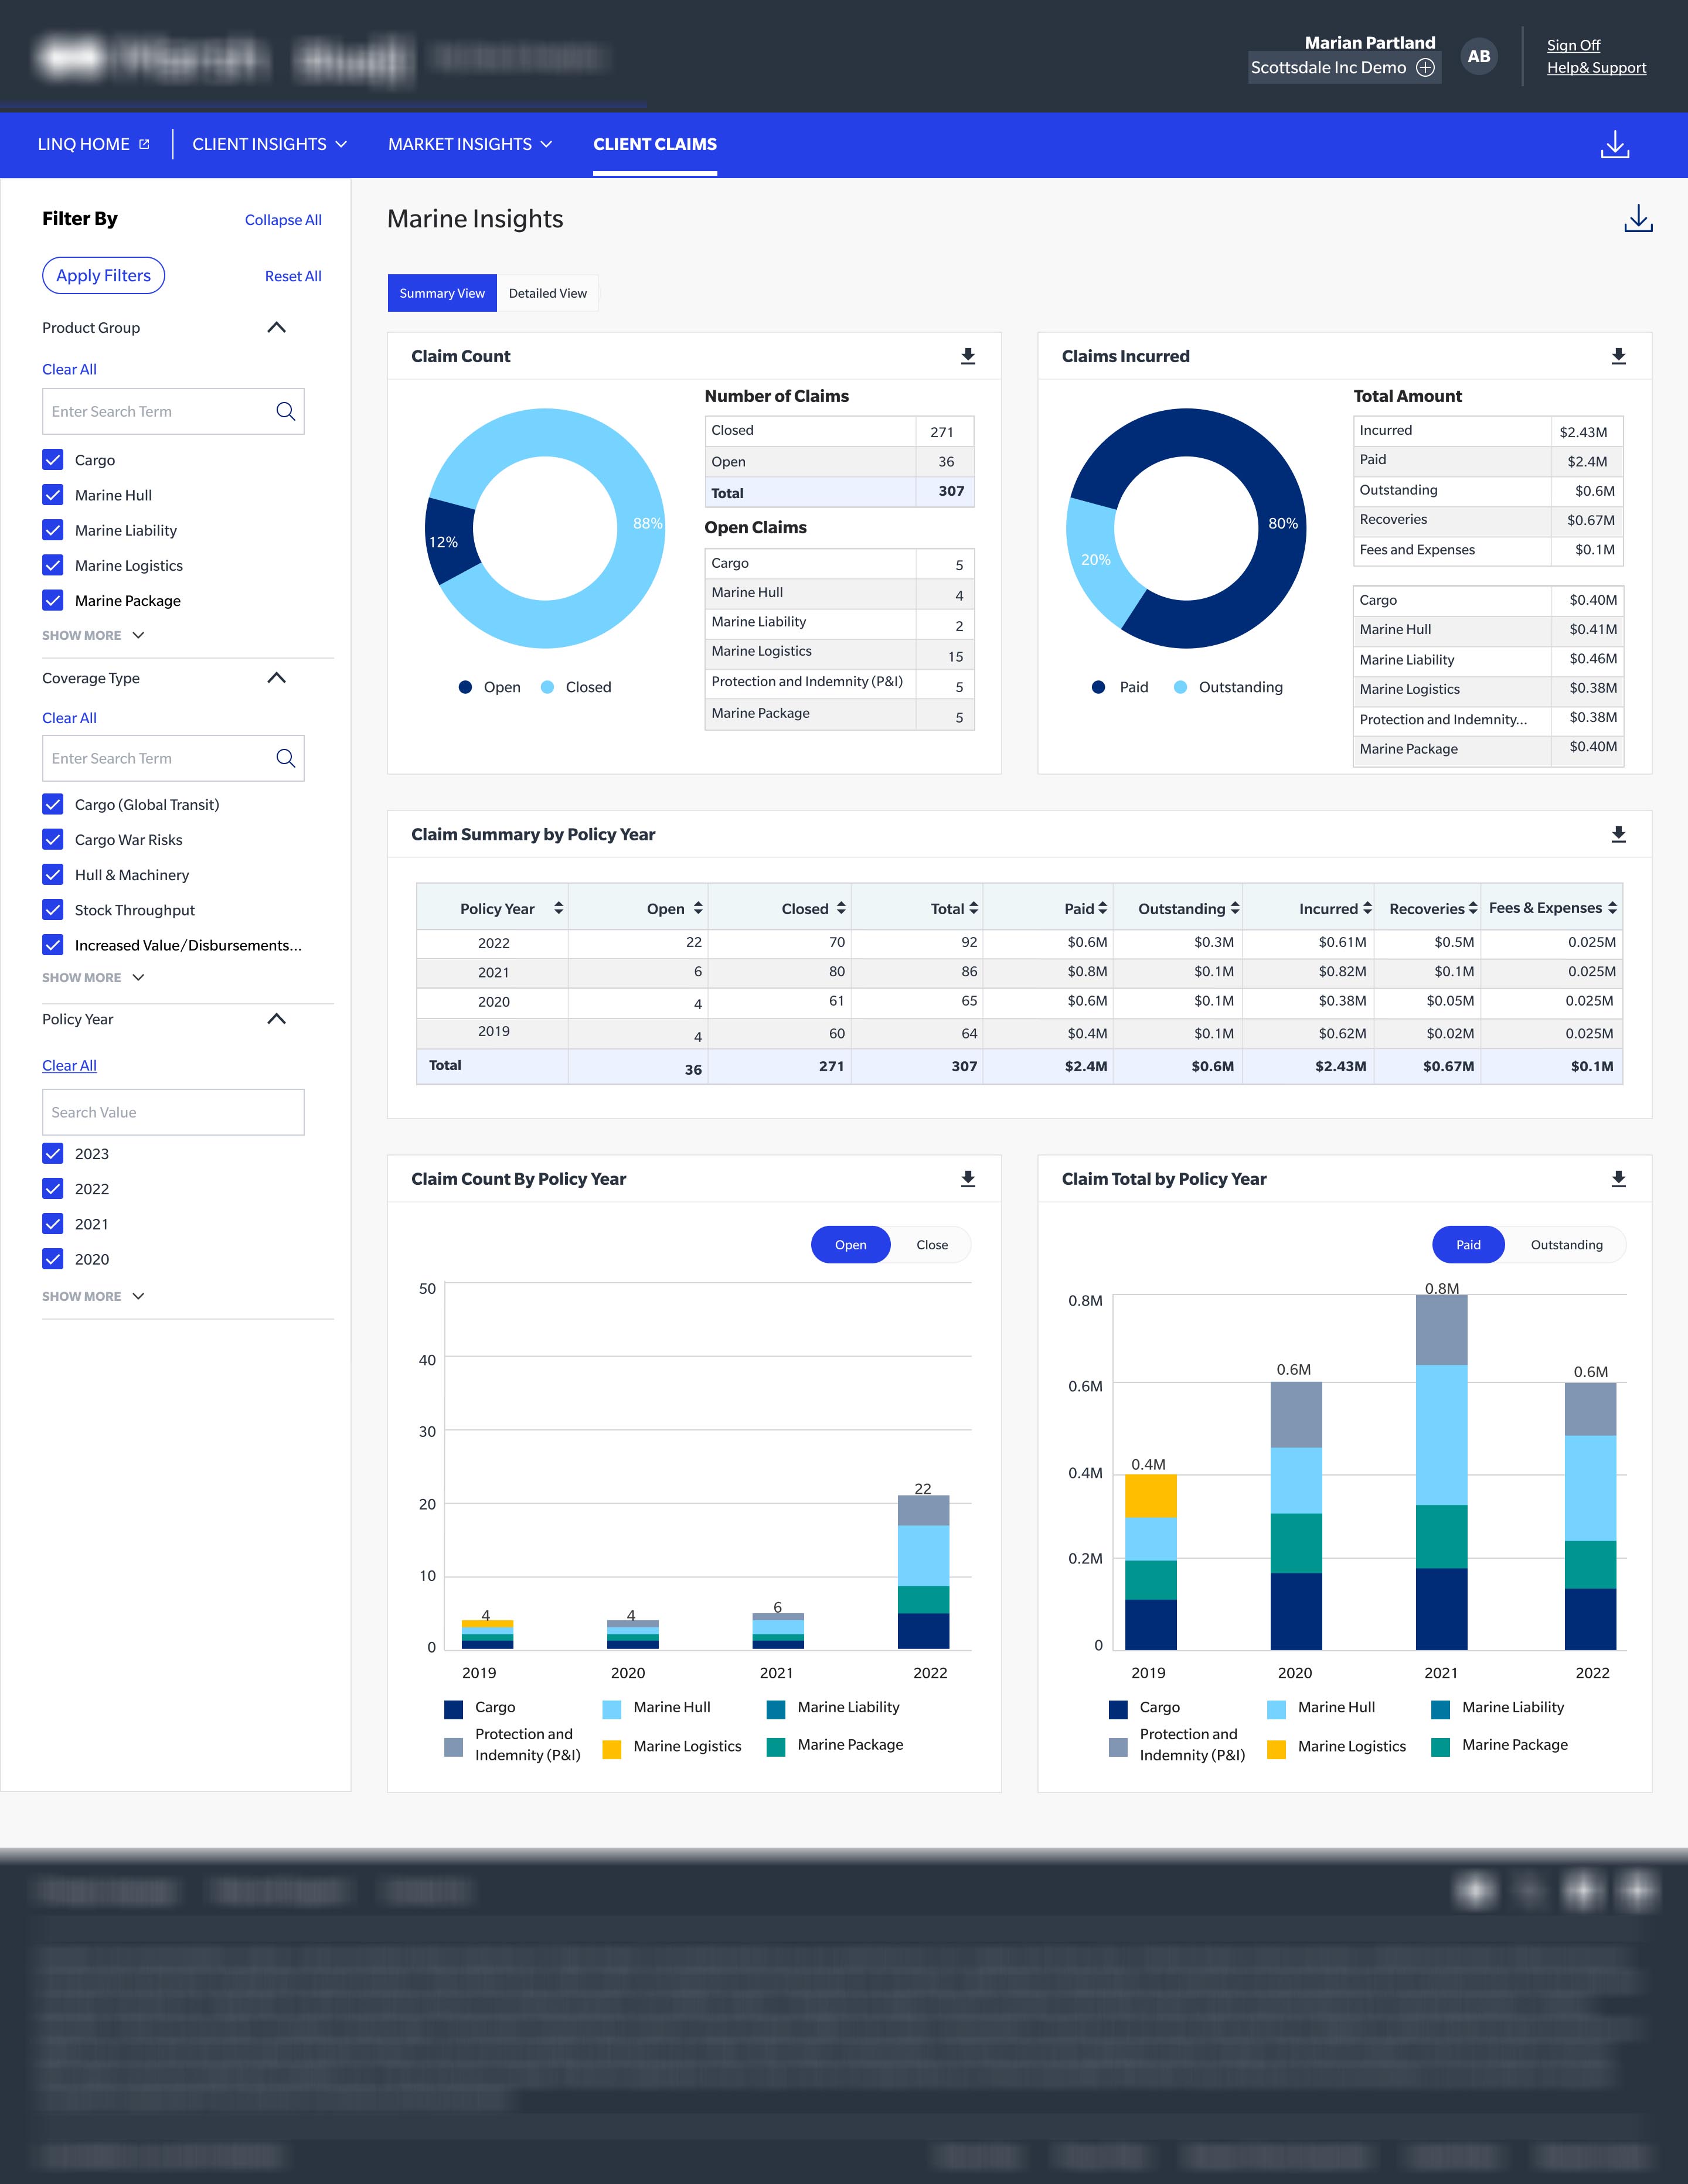
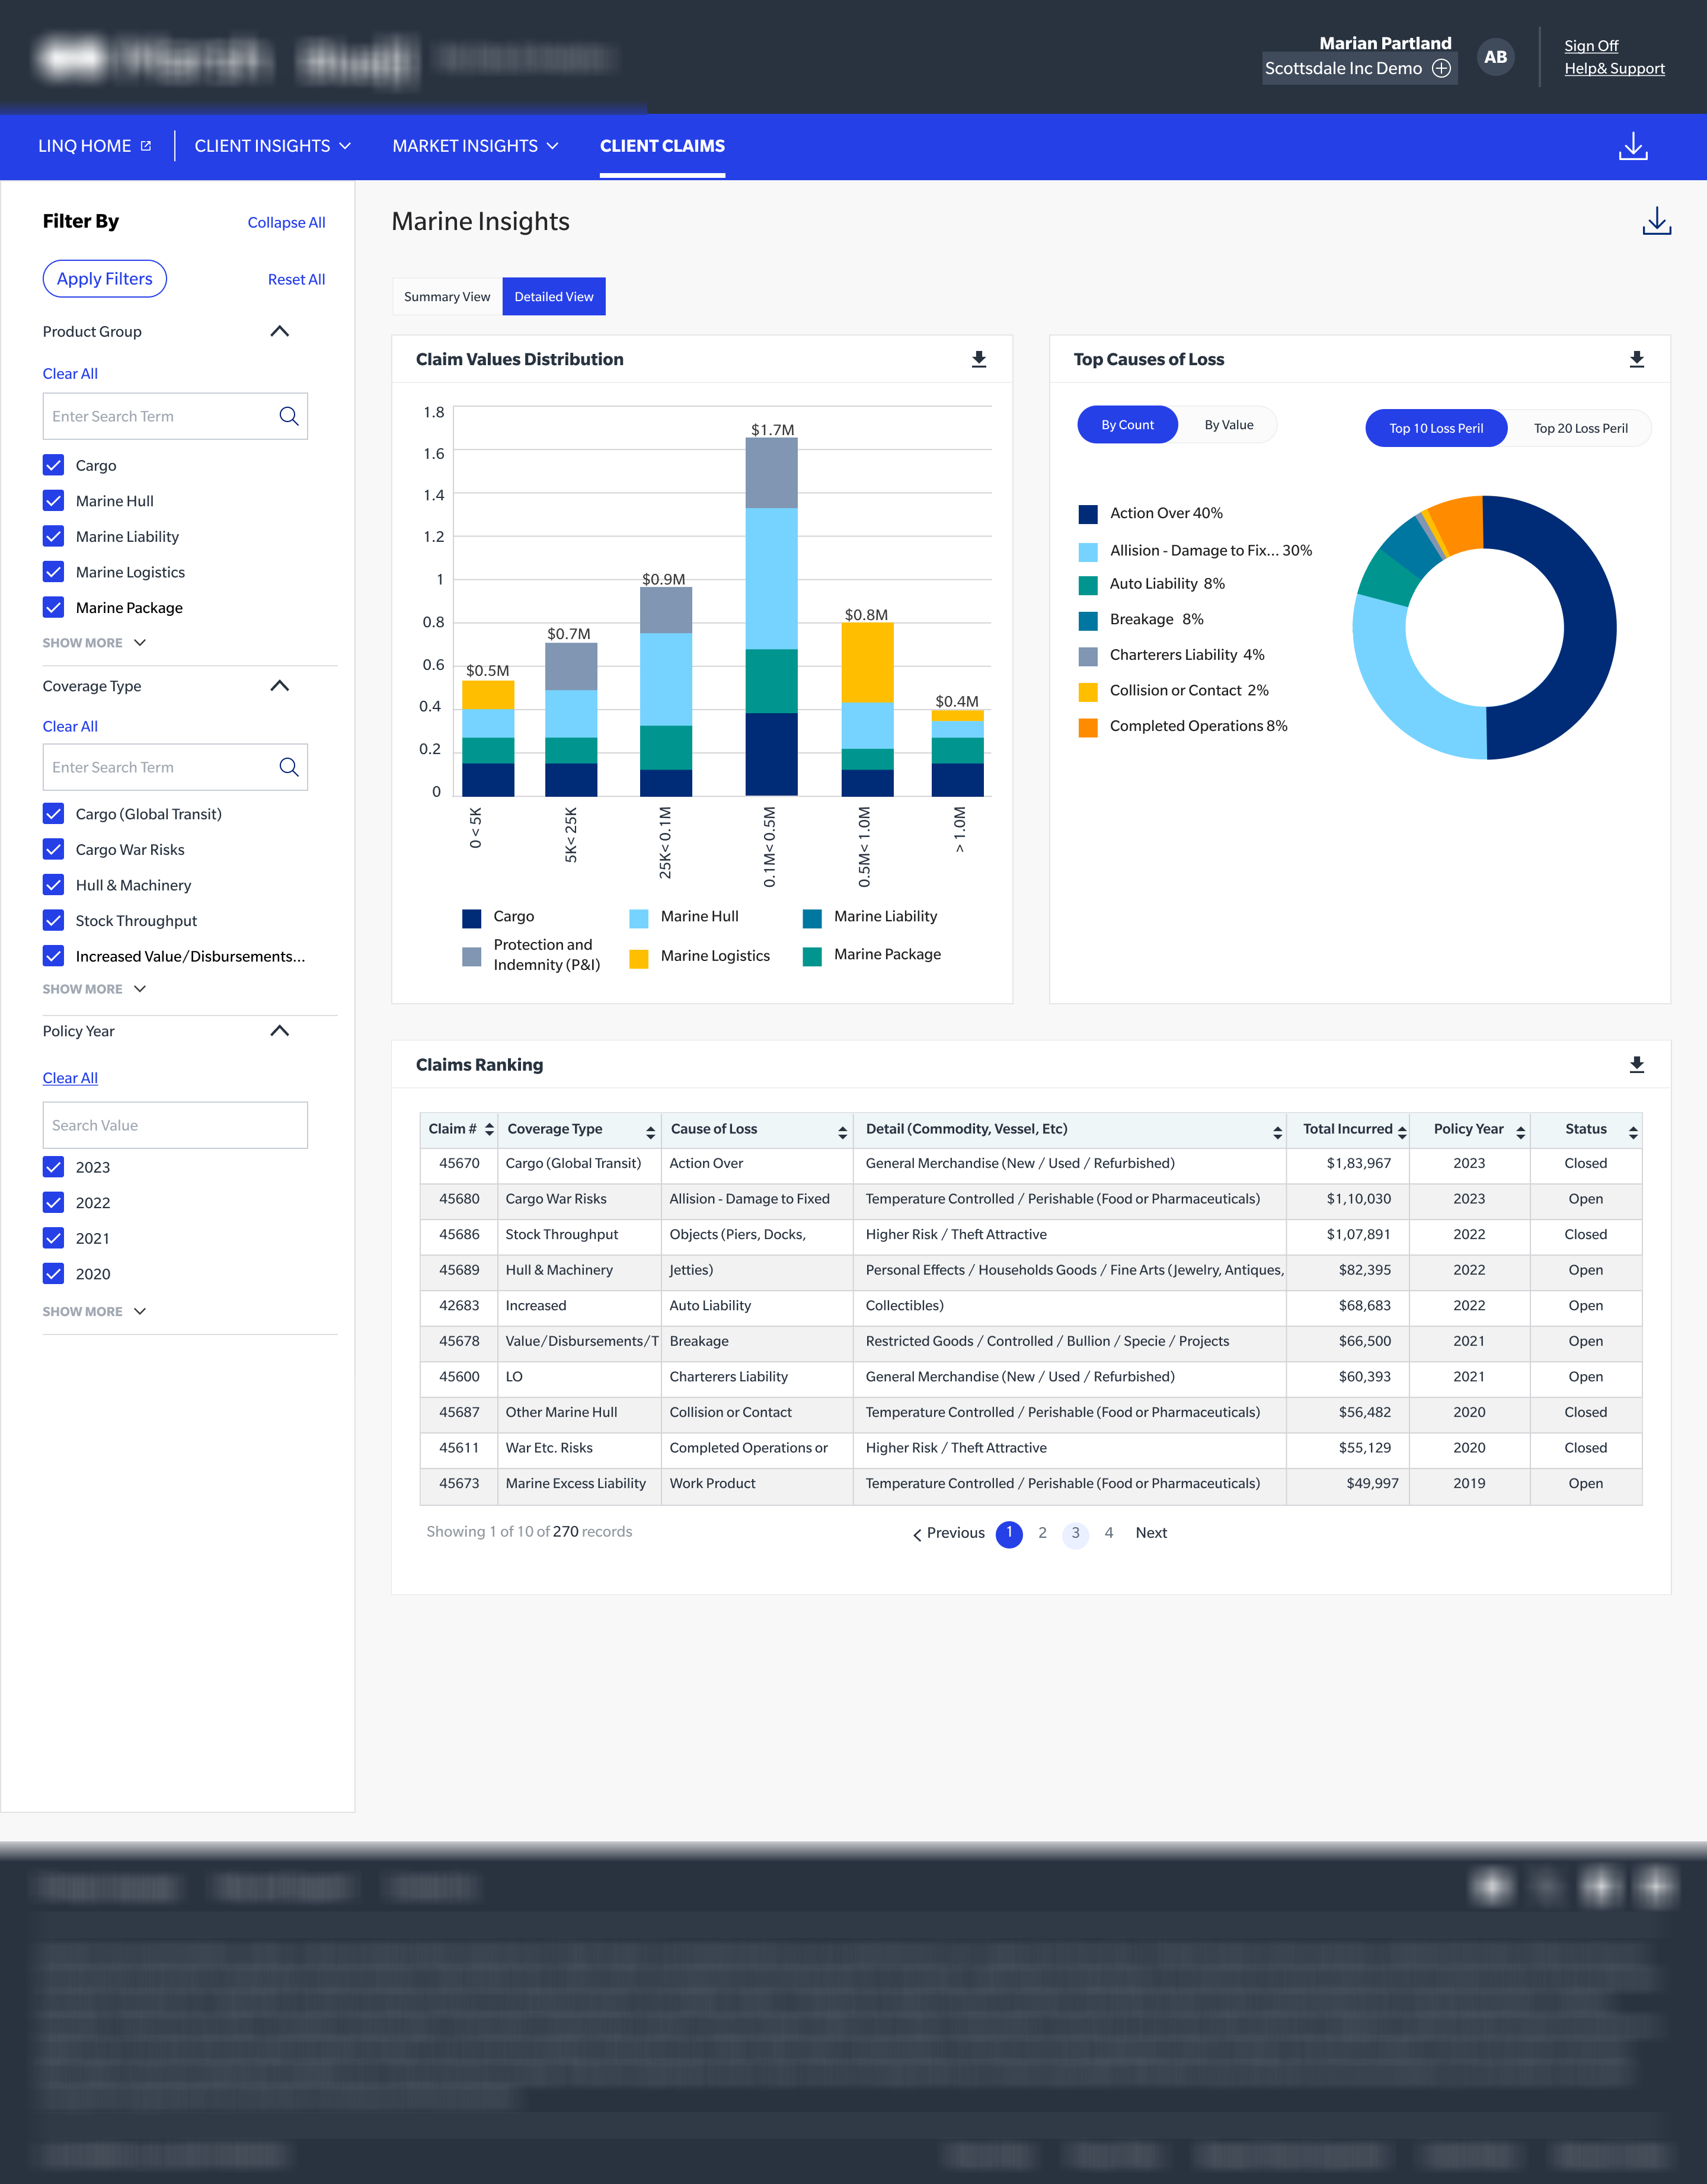
Designing the marine risk analytics platform — enabling underwriters and maritime insurers to assess entire vessel fleet portfolios, visualize claims geographically, and make faster, data-confident risk decisions.
Marine insurance is one of the most complex and data-rich lines of insurance. Underwriters managing large shipping company accounts needed to assess hundreds of vessels simultaneously — their routes, cargo types, age, flag state, claims history, and exposure across global trade lanes.
The existing toolset was a combination of Excel, Lloyd's data feeds piped into static tables, and email-based claims reports. There was no map. No fleet view. No AI signal. Underwriters were effectively flying blind when pricing risk for global shipping clients.
"I manage a fleet of 180 vessels for one client. I couldn't tell you right now which three are the highest risk without pulling six different reports."
— Senior Marine Underwriter, MarshZero spatial view of fleet positions, high-risk trade routes, or claims incident clustering by region. All data was in flat tables.
Assembling the data needed to price a single fleet renewal took 2-3 days of manual work across multiple data sources and systems.
Claims incidents were managed reactively by email. No early-warning system, no clustering detection, no severity scoring.
I embedded with the Marsh Marine team for three weeks, conducting contextual inquiry sessions with underwriters, claims handlers, and client-facing brokers. I also studied 6 competitive marine analytics tools — from Lloyd's Intelligence to Windward — to map the capability landscape.
The single biggest insight: underwriters trusted spatial reasoning. When I showed paper maps during interviews and said "imagine you could see your fleet here," eyes lit up. The map wasn't a nice-to-have — it was the mental model they already used. We just needed to digitize it with live data.
Underwriters spent 60% of their time on data retrieval vs risk analysis
Geographic clustering of incidents was invisible in tabular data — critical for pricing
AI-generated risk scores per vessel were the most anticipated feature
Clients wanted self-service fleet reports without waiting on brokers
Manages 5-20 large shipping company accounts. Needs fleet-level risk overview, vessel-level drill-down, and AI risk scoring to support pricing decisions. Primary user.
Receives incident reports, triages severity, coordinates surveyor dispatch. Needs geographic incident view, severity scoring, and timeline tracking.
CFO or Risk Manager at a shipping company. Uses self-service portal to view their fleet's risk profile, upcoming renewals, and claims status.
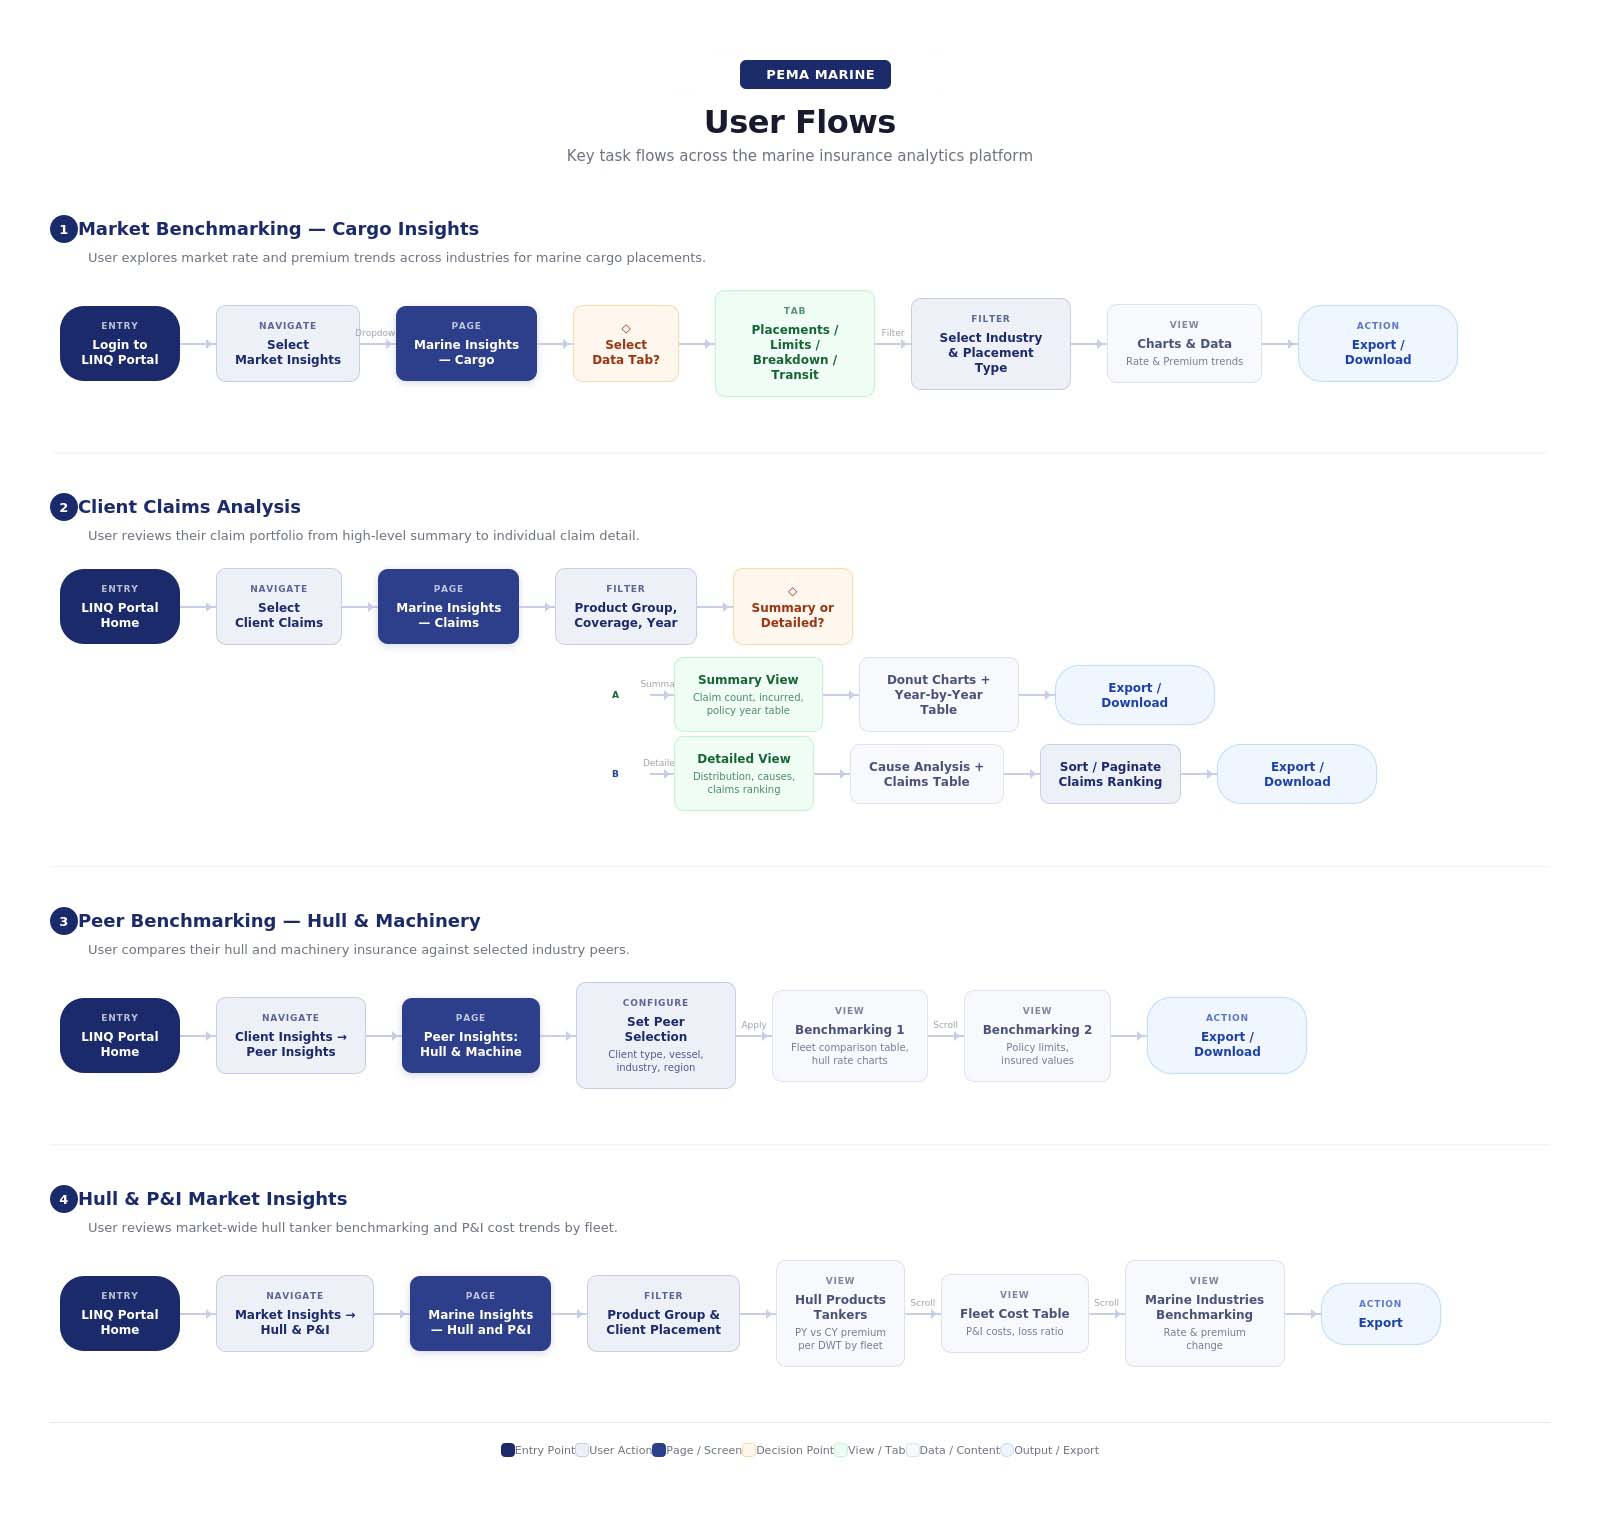
Before designing screens, I mapped the full product structure and end-to-end user journeys — ensuring every module had a clear place in the hierarchy and every task had a frictionless path for underwriters and claims handlers.
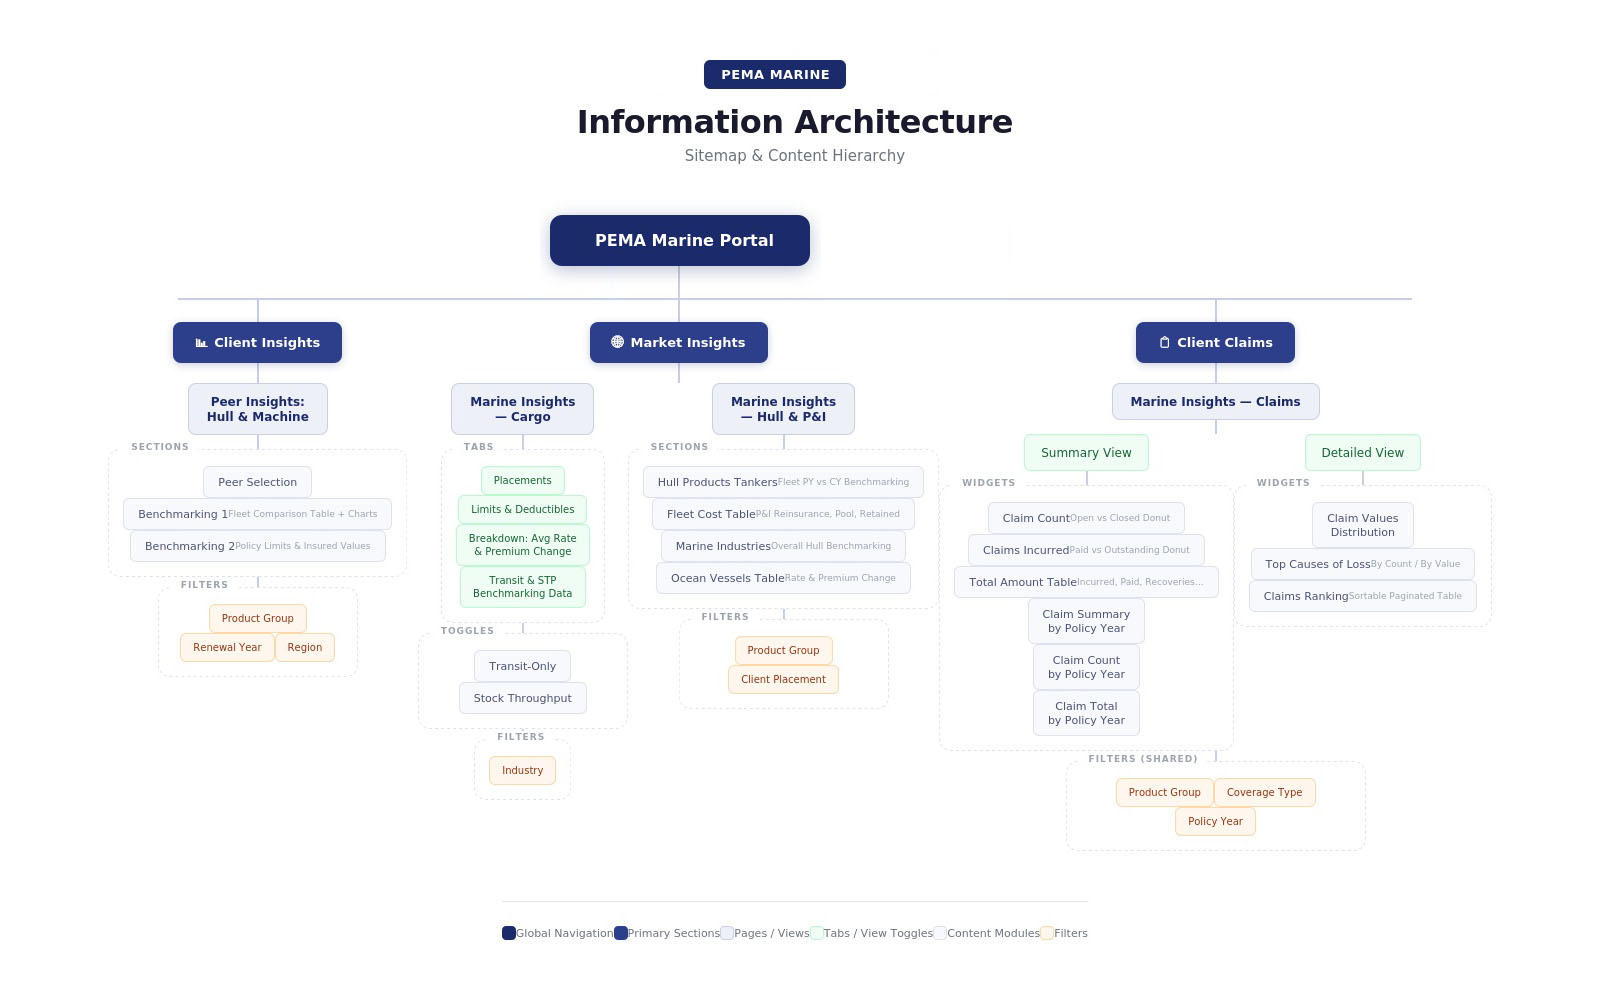
Card sorting with 8 underwriters to define information hierarchy
Mapped 14 data sources to establish what's available vs needed
3-day design sprint generating 12 concepts — narrowed to 2 directions
Interactive hi-fi prototype with real AIS vessel data for user testing
4 rounds of testing — each with 5 marine underwriters
14 significant design changes driven by usability findings
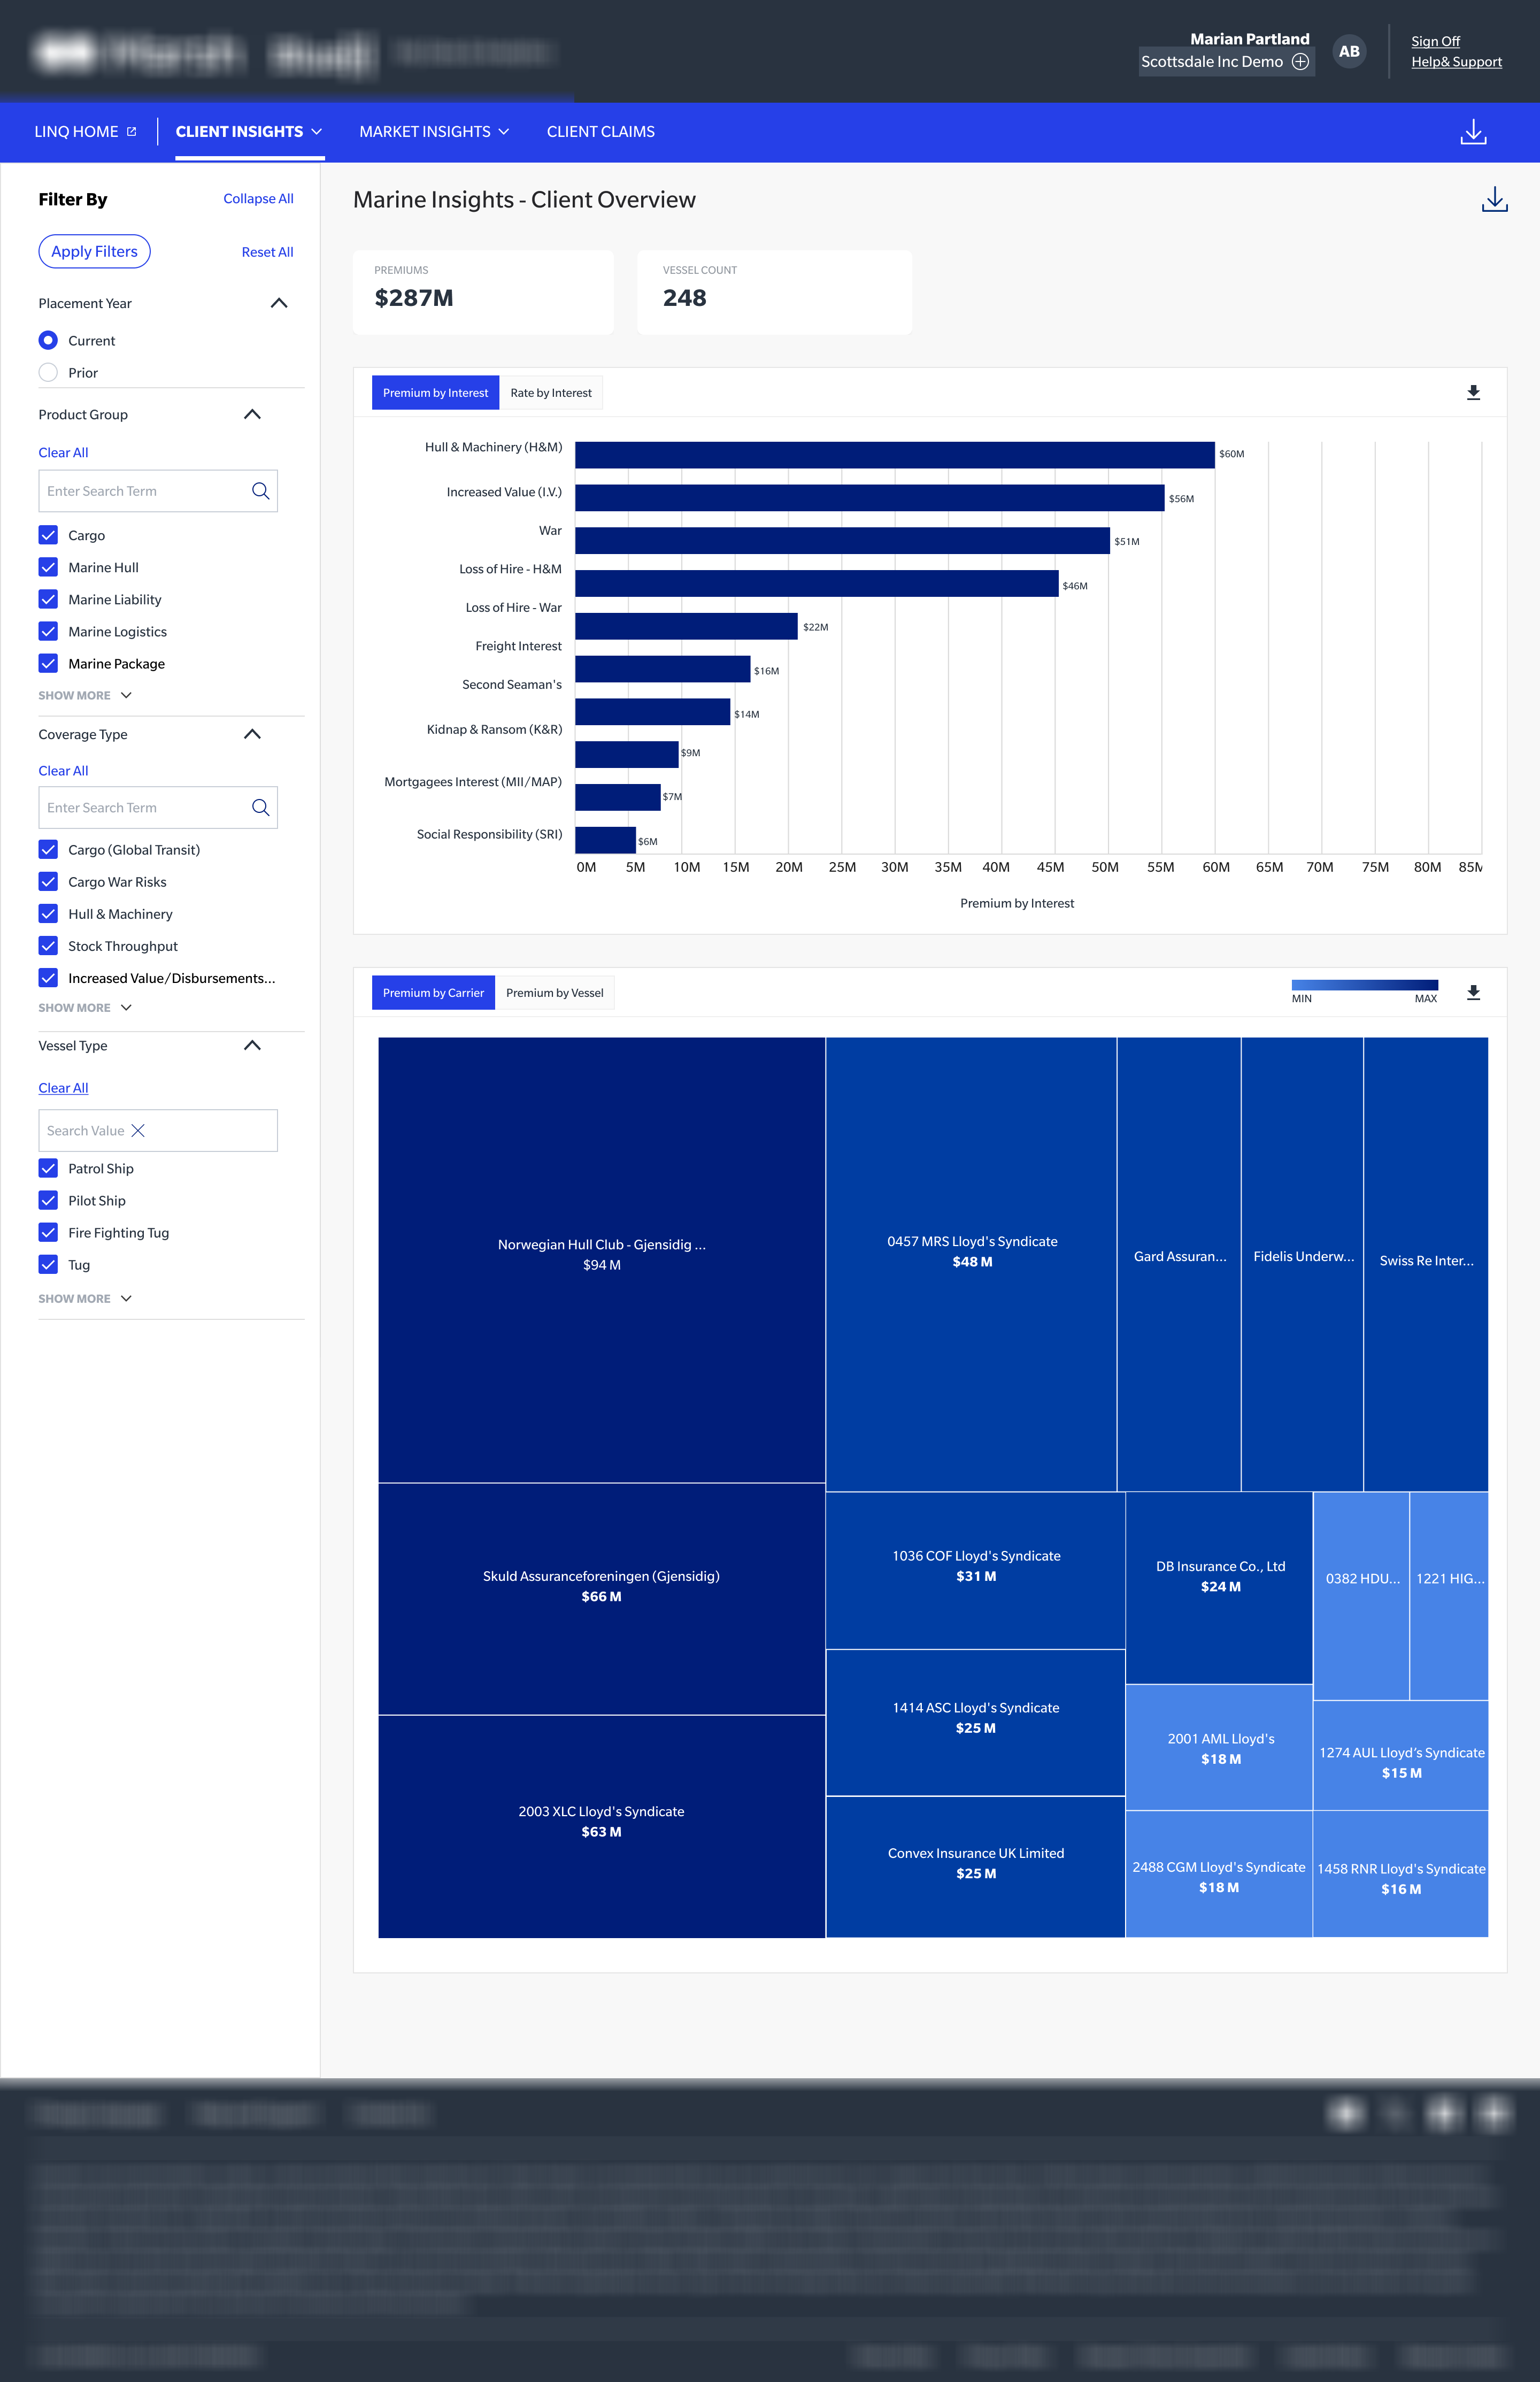
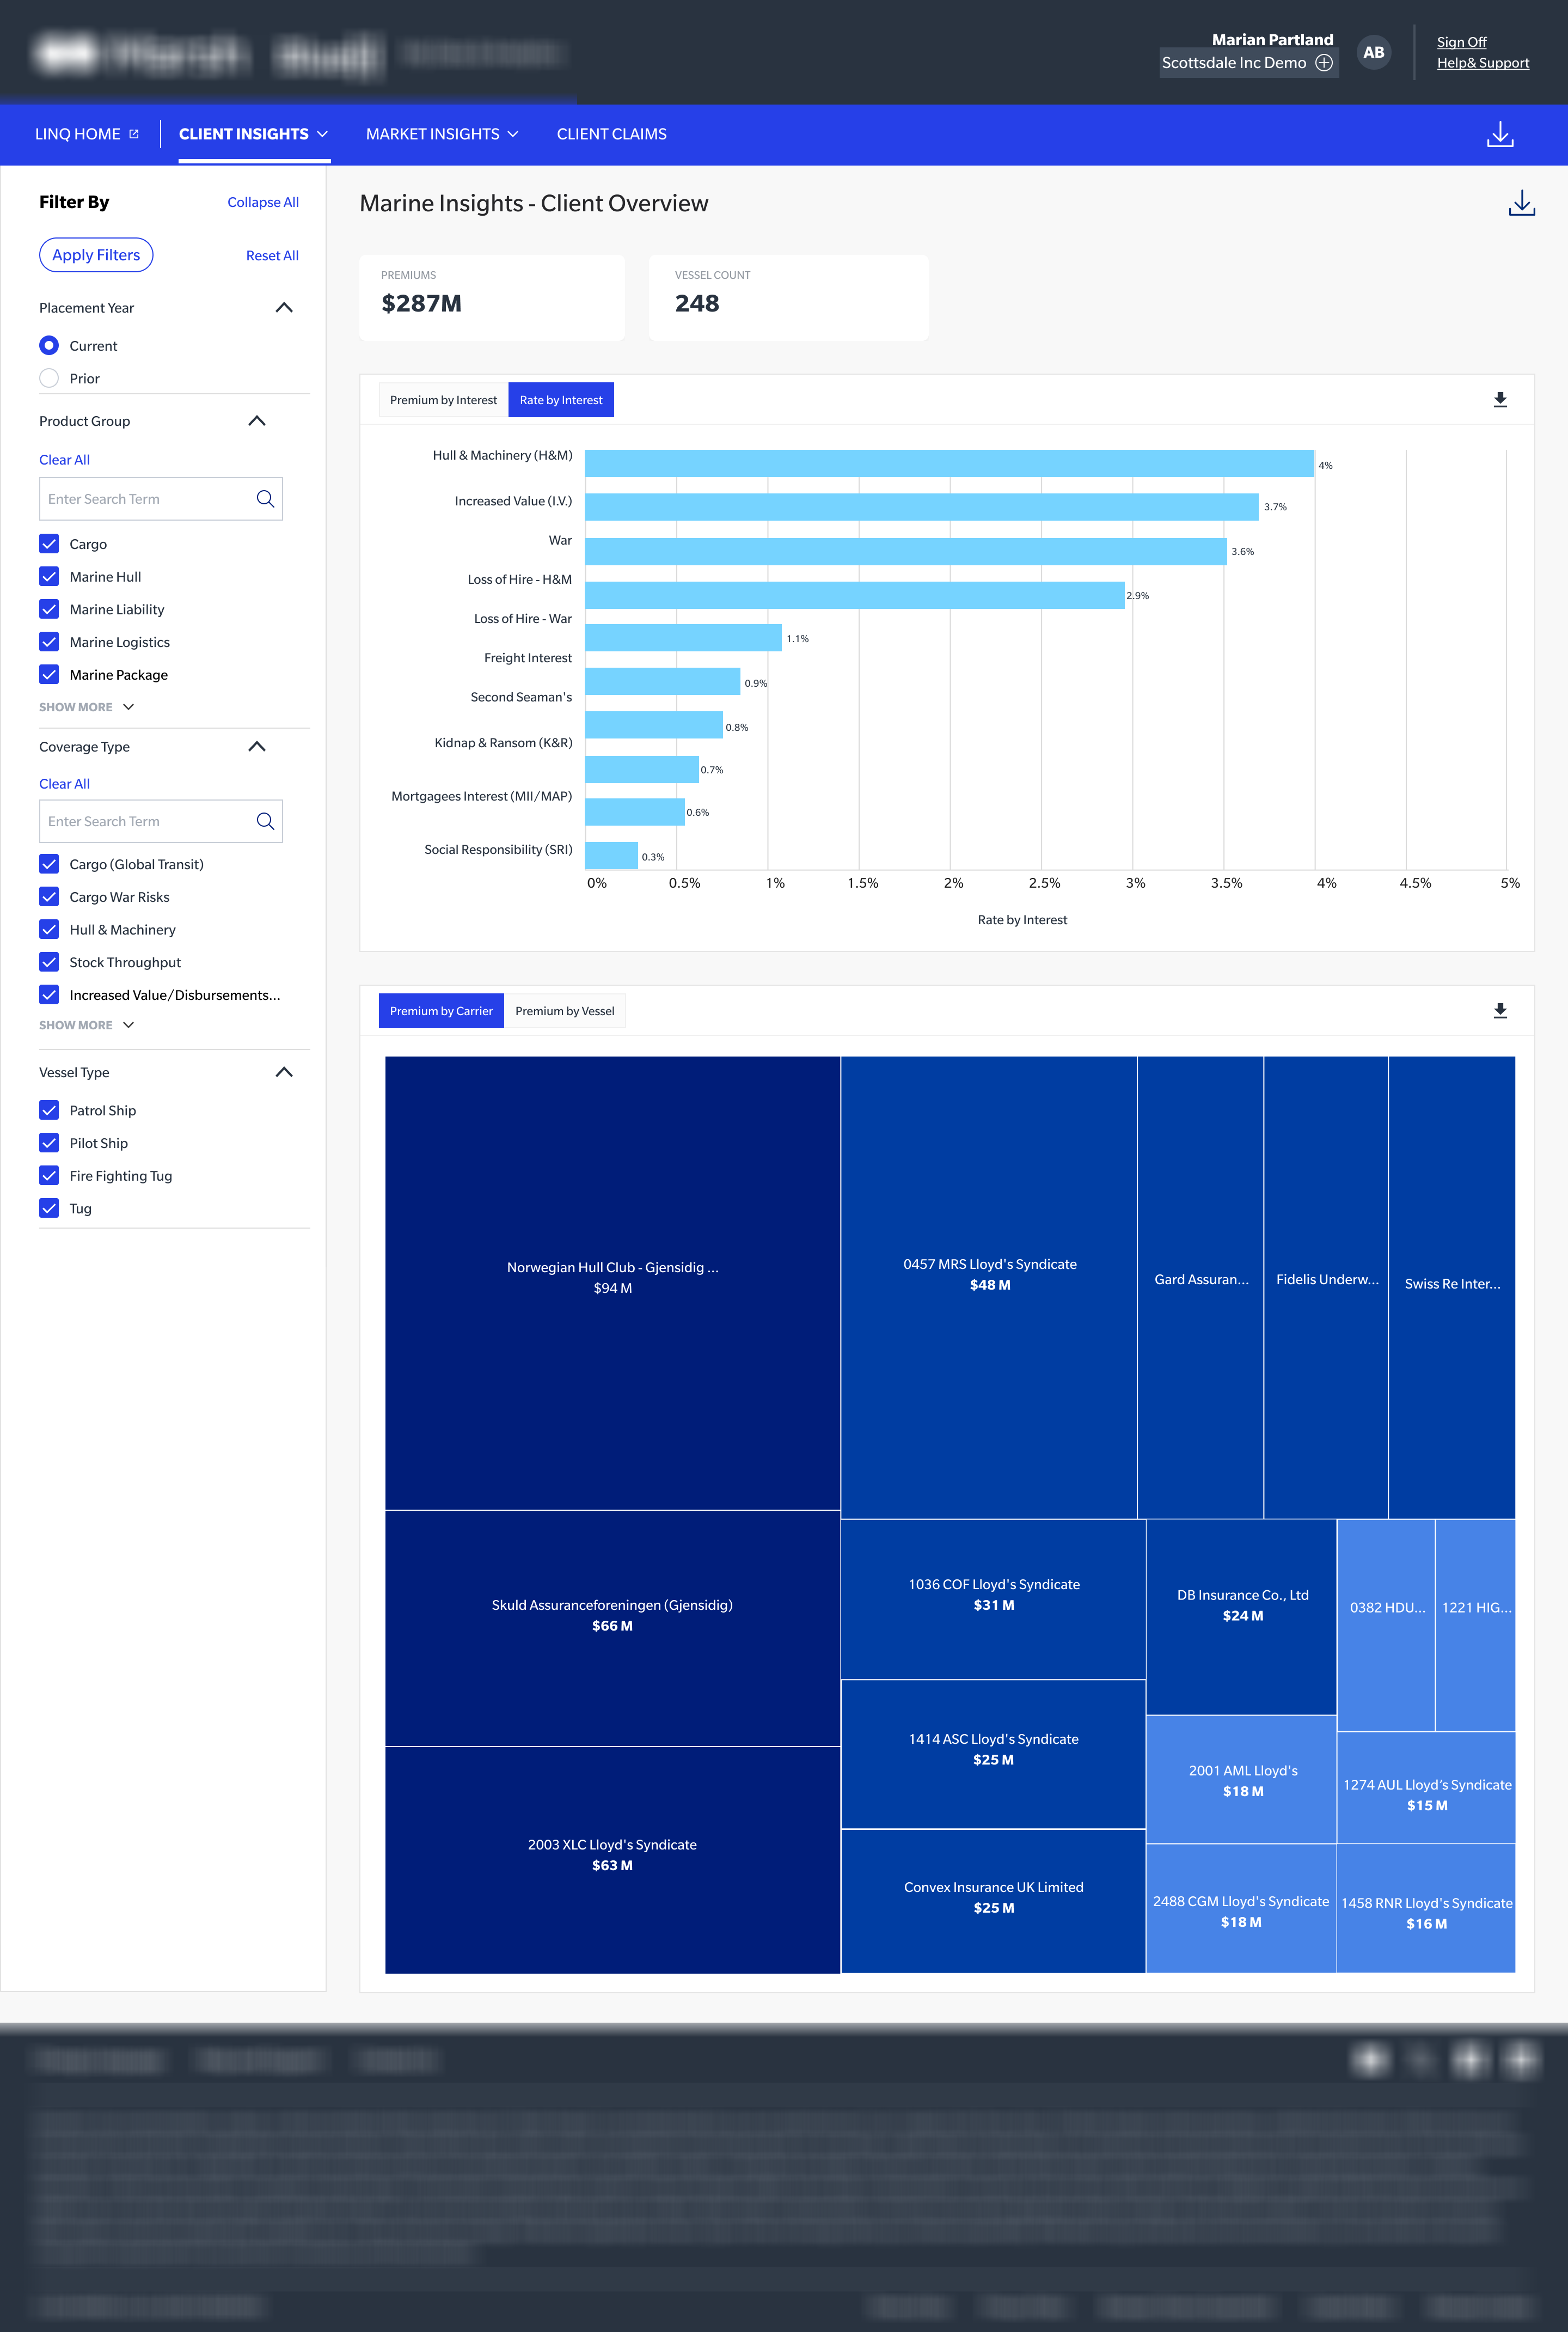
The entire platform is anchored to a live world map showing vessel positions, risk heat zones, and incident clusters. Users can zoom from global view to individual vessel in two clicks. This replaced 6 separate report screens.
Every vessel receives a composite AI risk score (1-100) derived from 18 signals: age, flag state, class society, route history, claims frequency, cargo type, and more. Underwriters can interrogate the score breakdown in detail.
Claims handlers receive a real-time alert feed with AI-severity scoring. Incidents in high-loss regions or involving repeat-offender vessels are automatically escalated, reducing triage time from hours to minutes.
PEMA Marine launched to Marsh's marine underwriting teams in Q1 2024. The map-first design changed how underwriters approached risk assessments — shifting from document-centric to spatially-aware workflows.
45% faster average risk assessment time per fleet account
$7.8M in over-coverage and mispricings identified in first 9 months
78% faster claims triage via geographic incident clustering view
5× increase in data sources actively referenced during renewal decisions
Adopted by 8 of Marsh's top 10 marine underwriting teams within 6 months
AI risk score accuracy rated "highly reliable" by 88% of underwriters
"The map changed everything. I can see in 30 seconds what used to take me a day. And the AI risk scores — they're not perfect, but they're good enough to trust for initial triage."
— Lead Marine Underwriter, Marsh (Post-Launch Interview)The most important design lesson: domain experts have strong mental models that you should amplify, not replace. Underwriters already thought spatially about risk — they just lacked the digital tool to match that mental model. Building the map as the primary navigation layer was not an innovation; it was an alignment. The innovation was connecting it to live data, AI scoring, and actionable workflows.
I'm open to senior UX roles and consulting engagements.