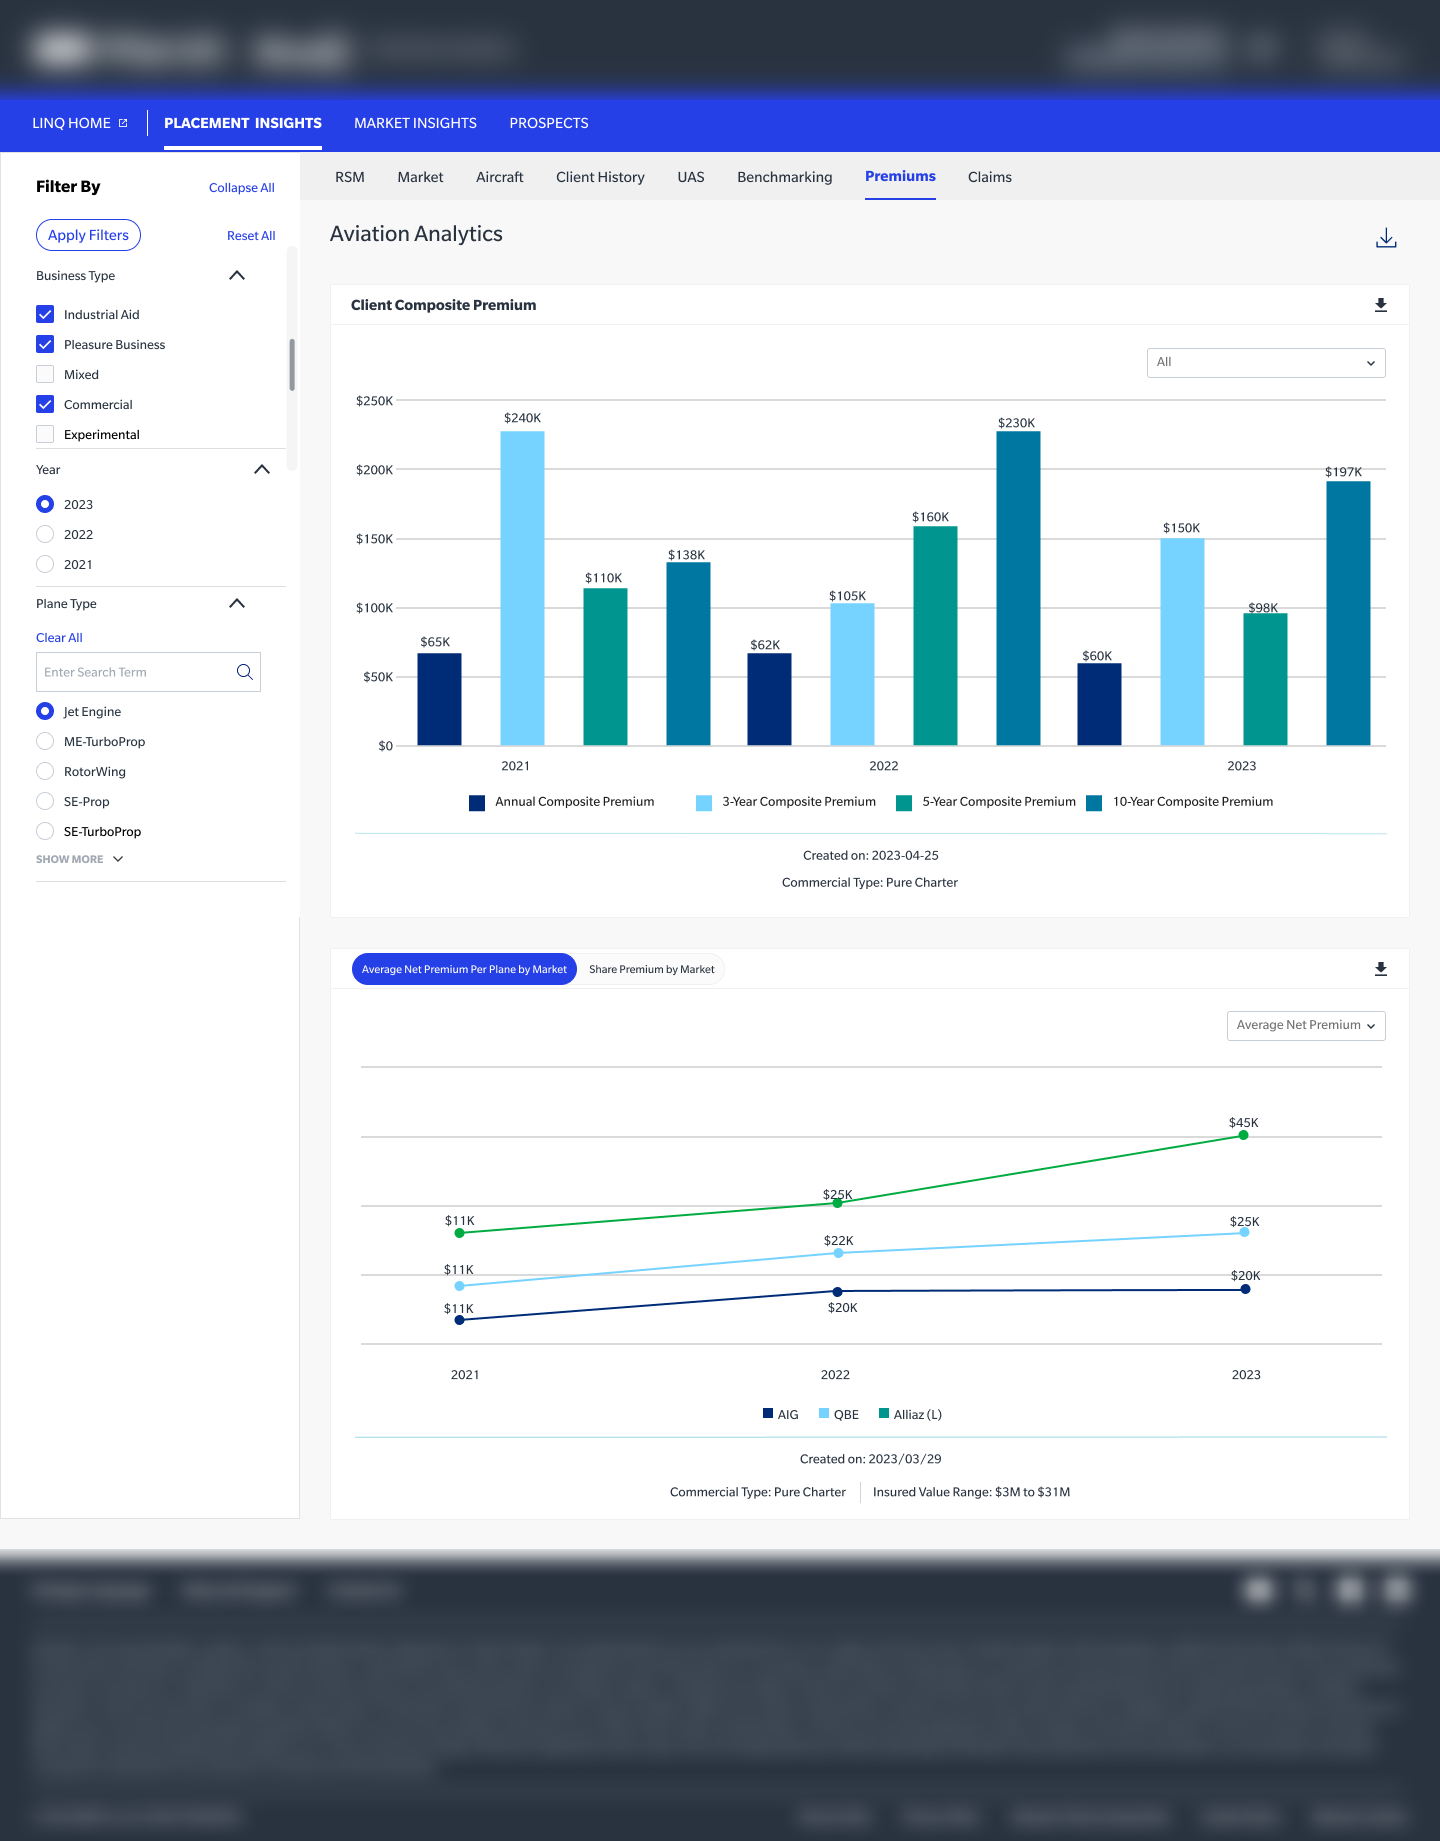
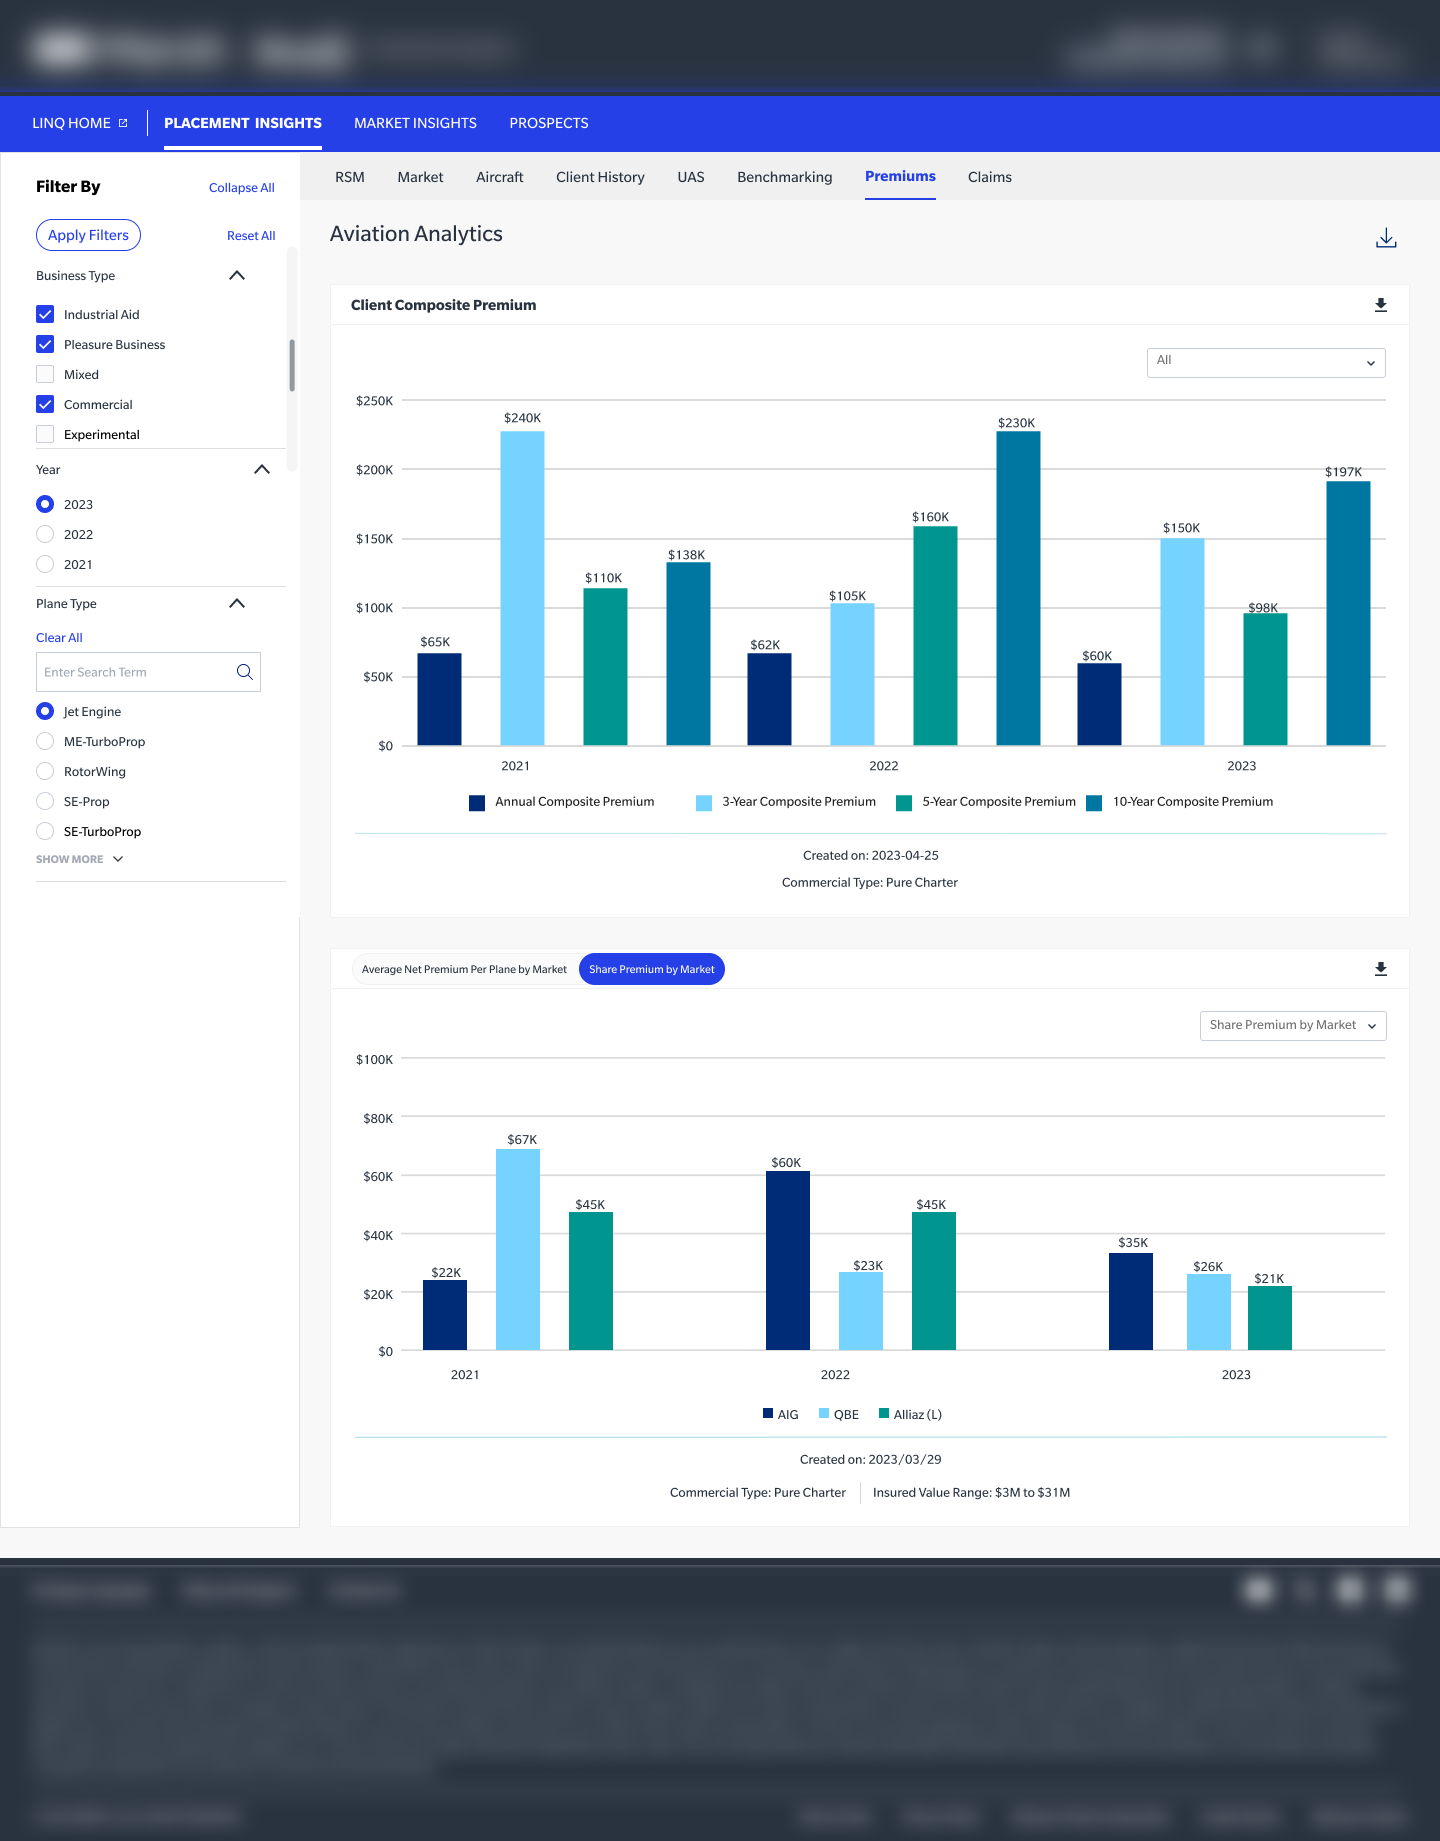
Design Output
Key Screens
![Blue[i] Spec-Avi Platform Overview](images/Case%20study/Aviation%20Commercial/Blue[i] Specialty-Avi-Commercial-V5.png)
RSM — Placement Insights Analytics
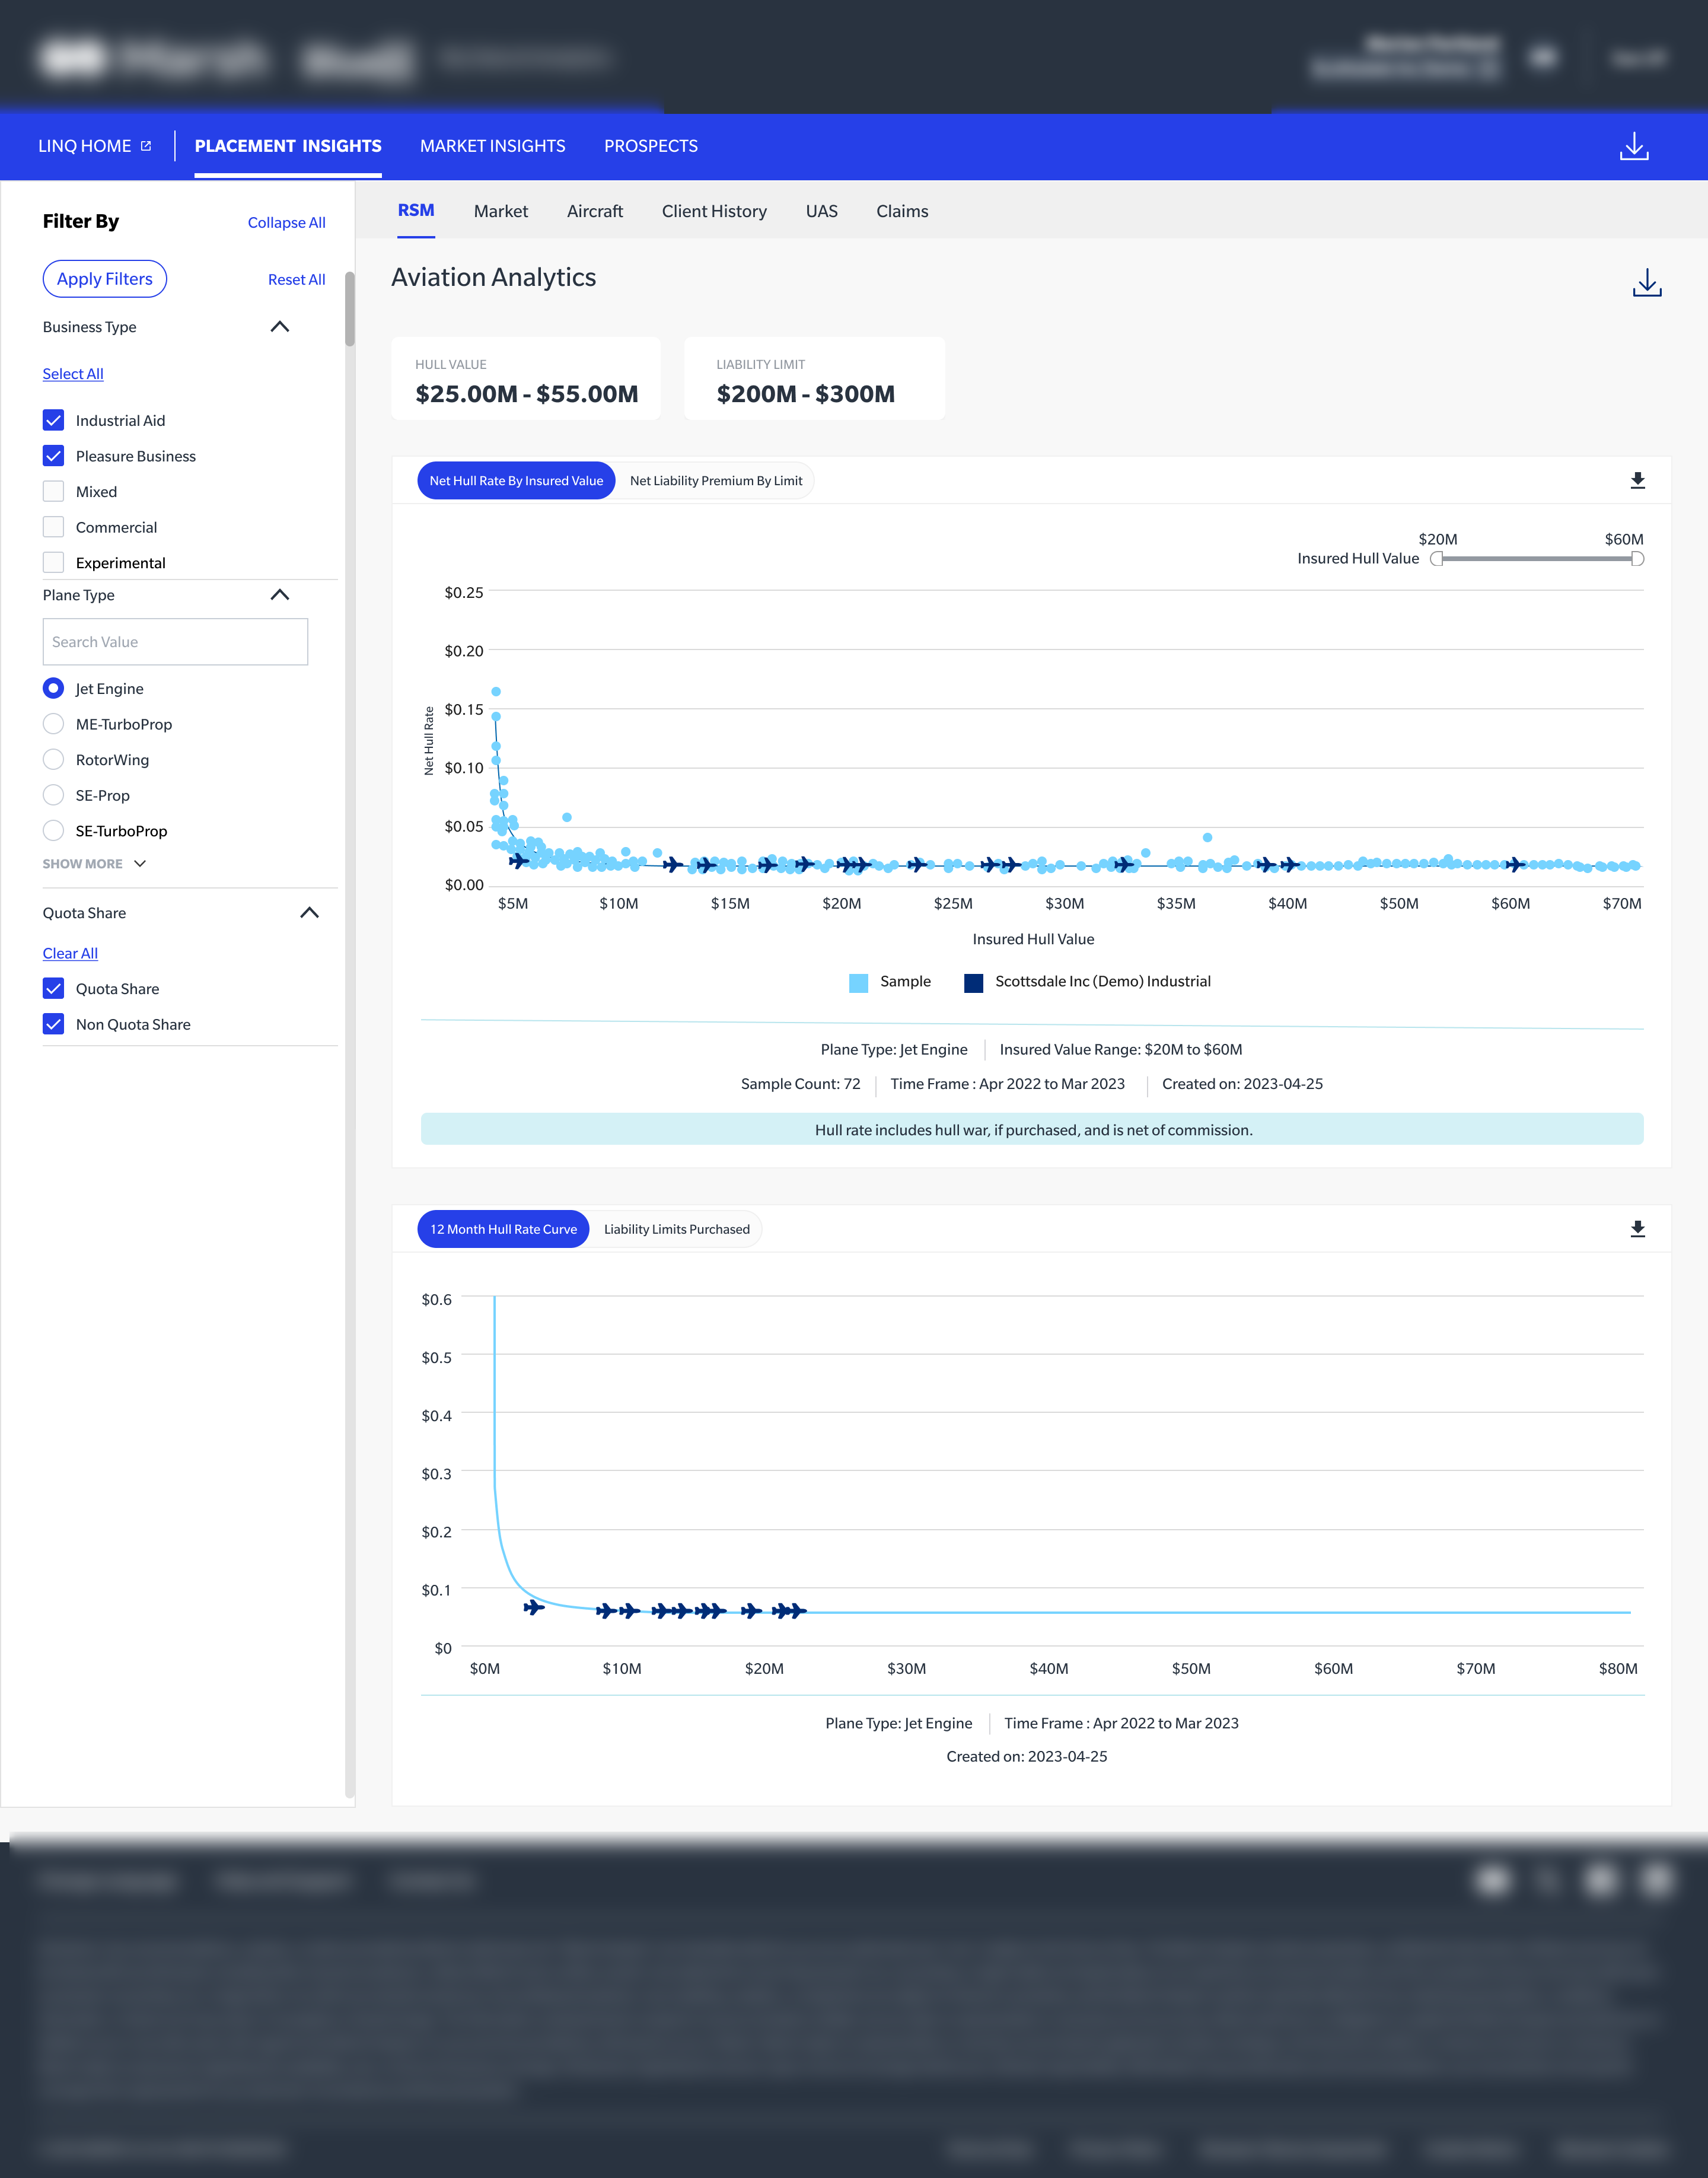
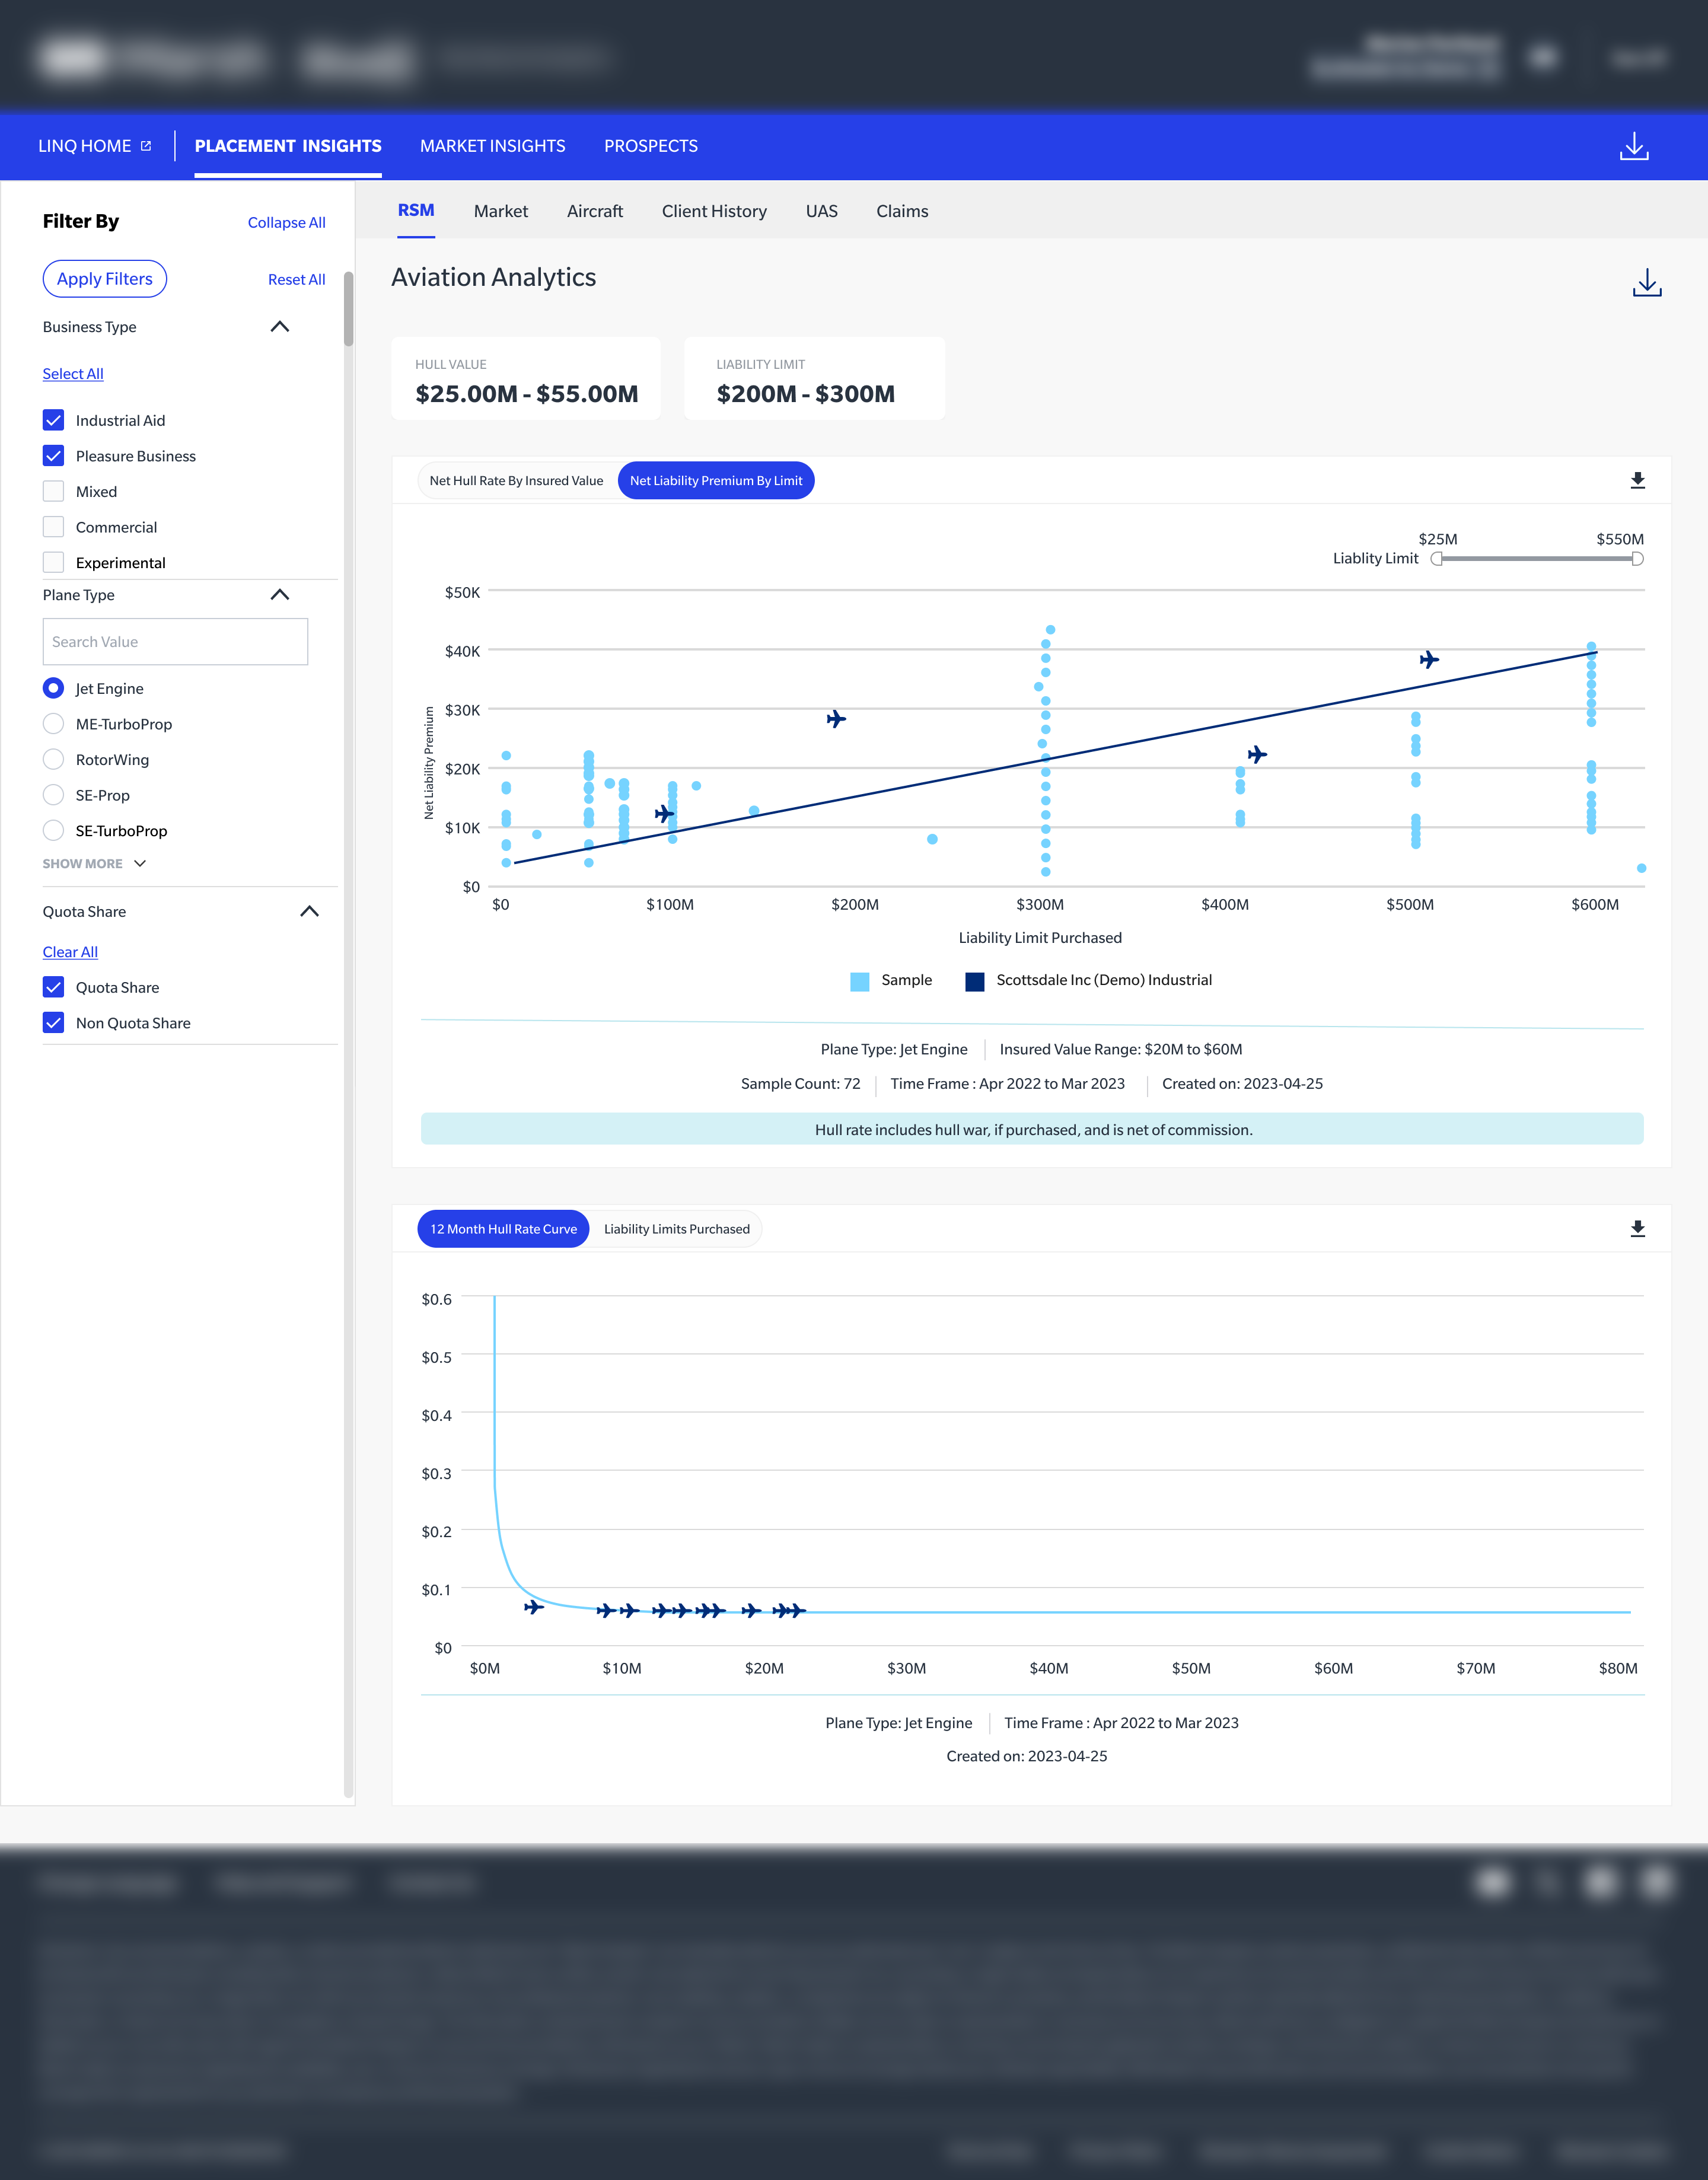
Market Intelligence & Aircraft Portfolio
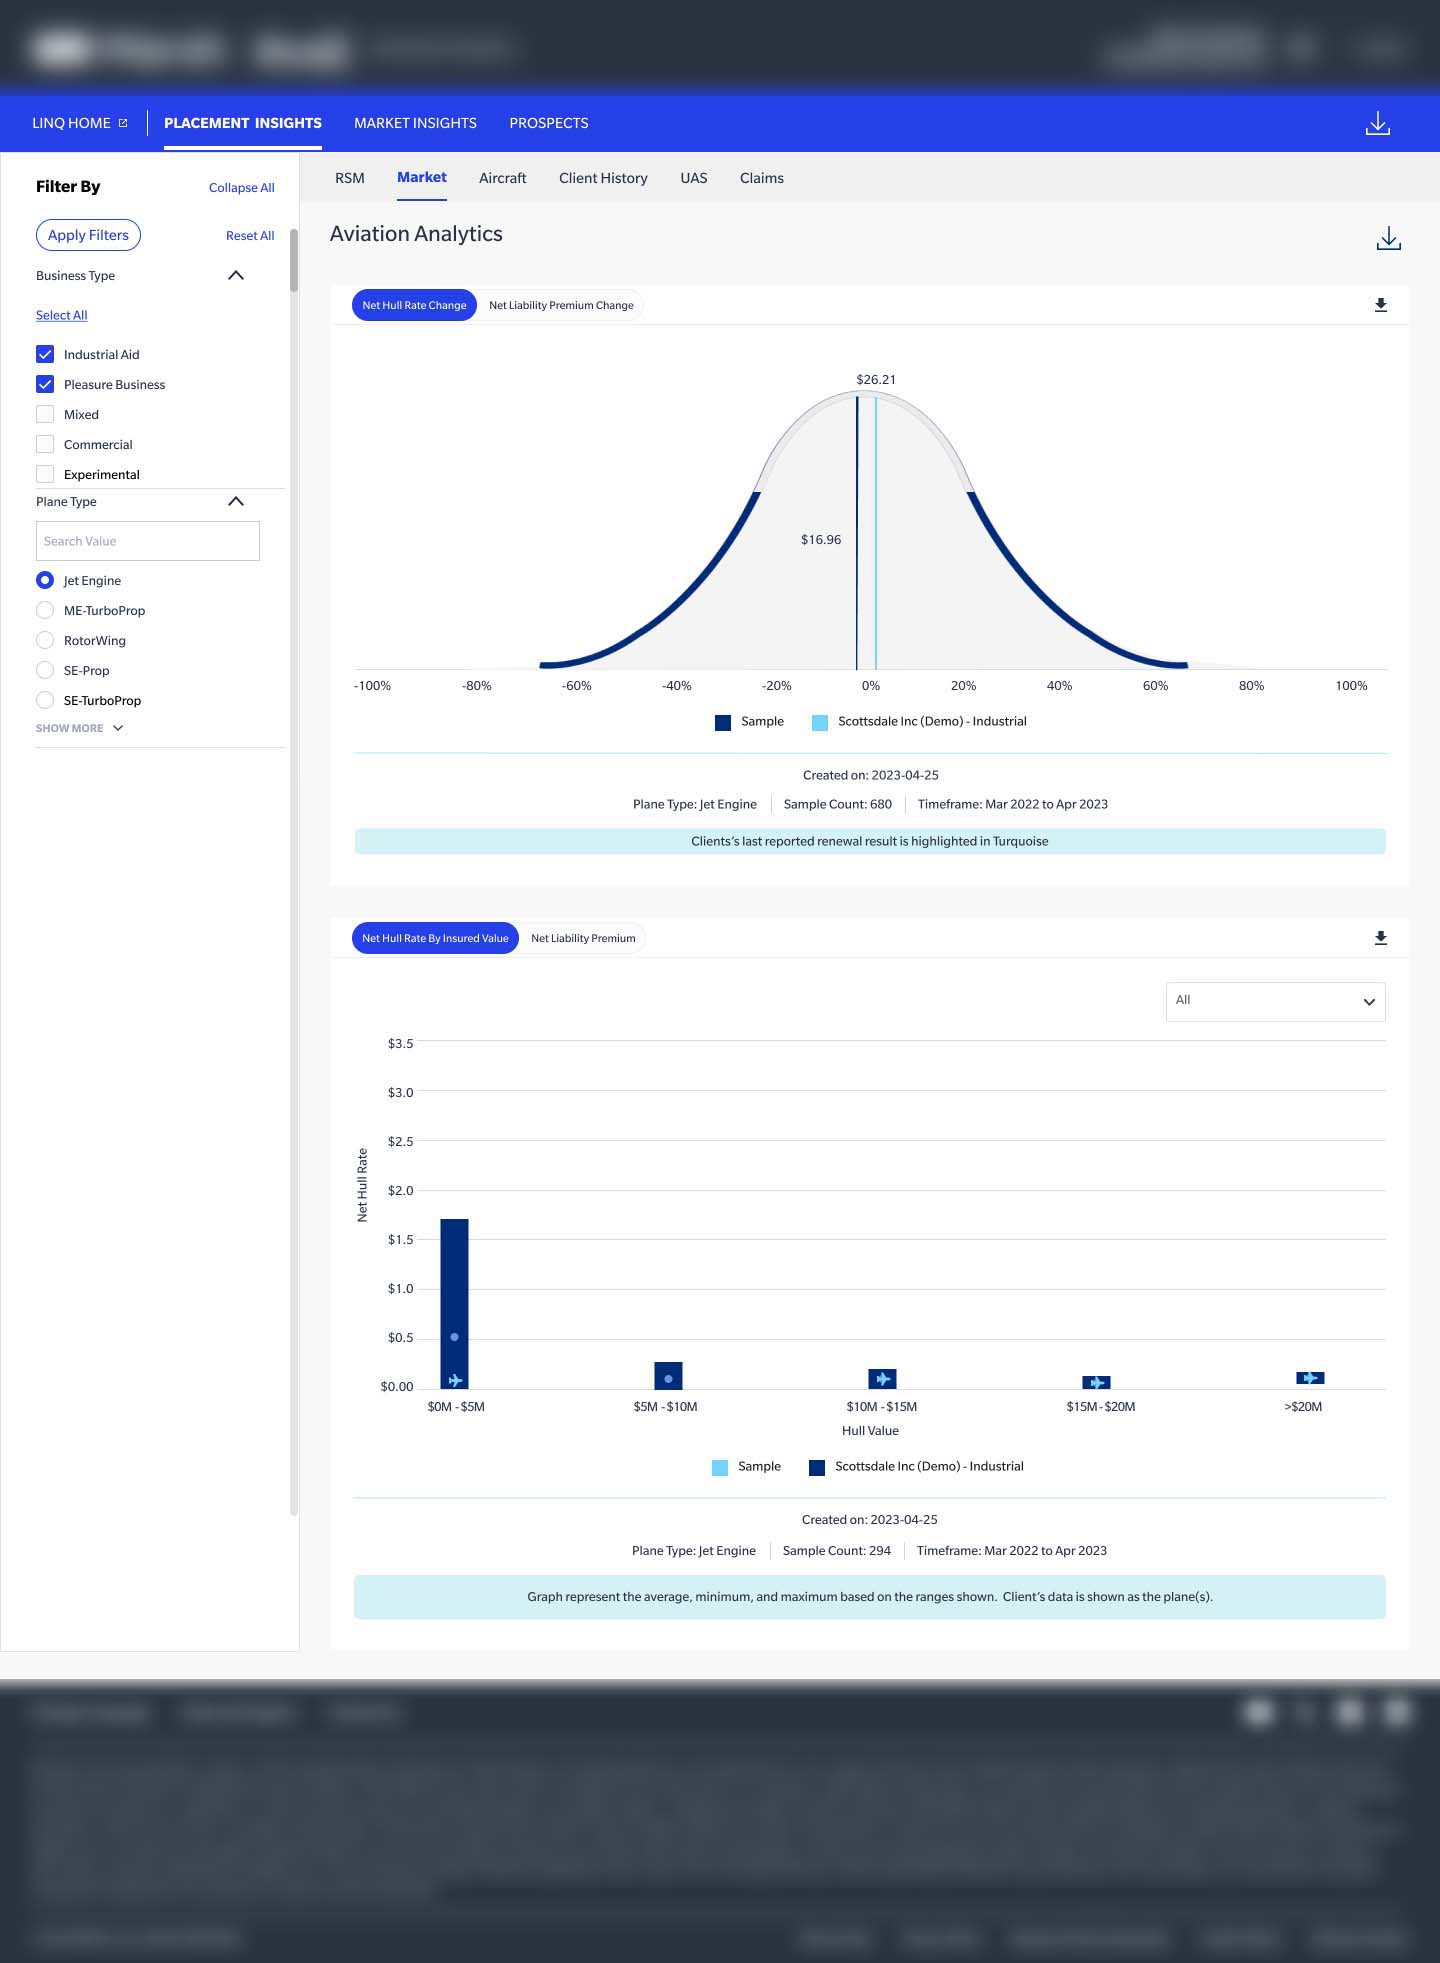
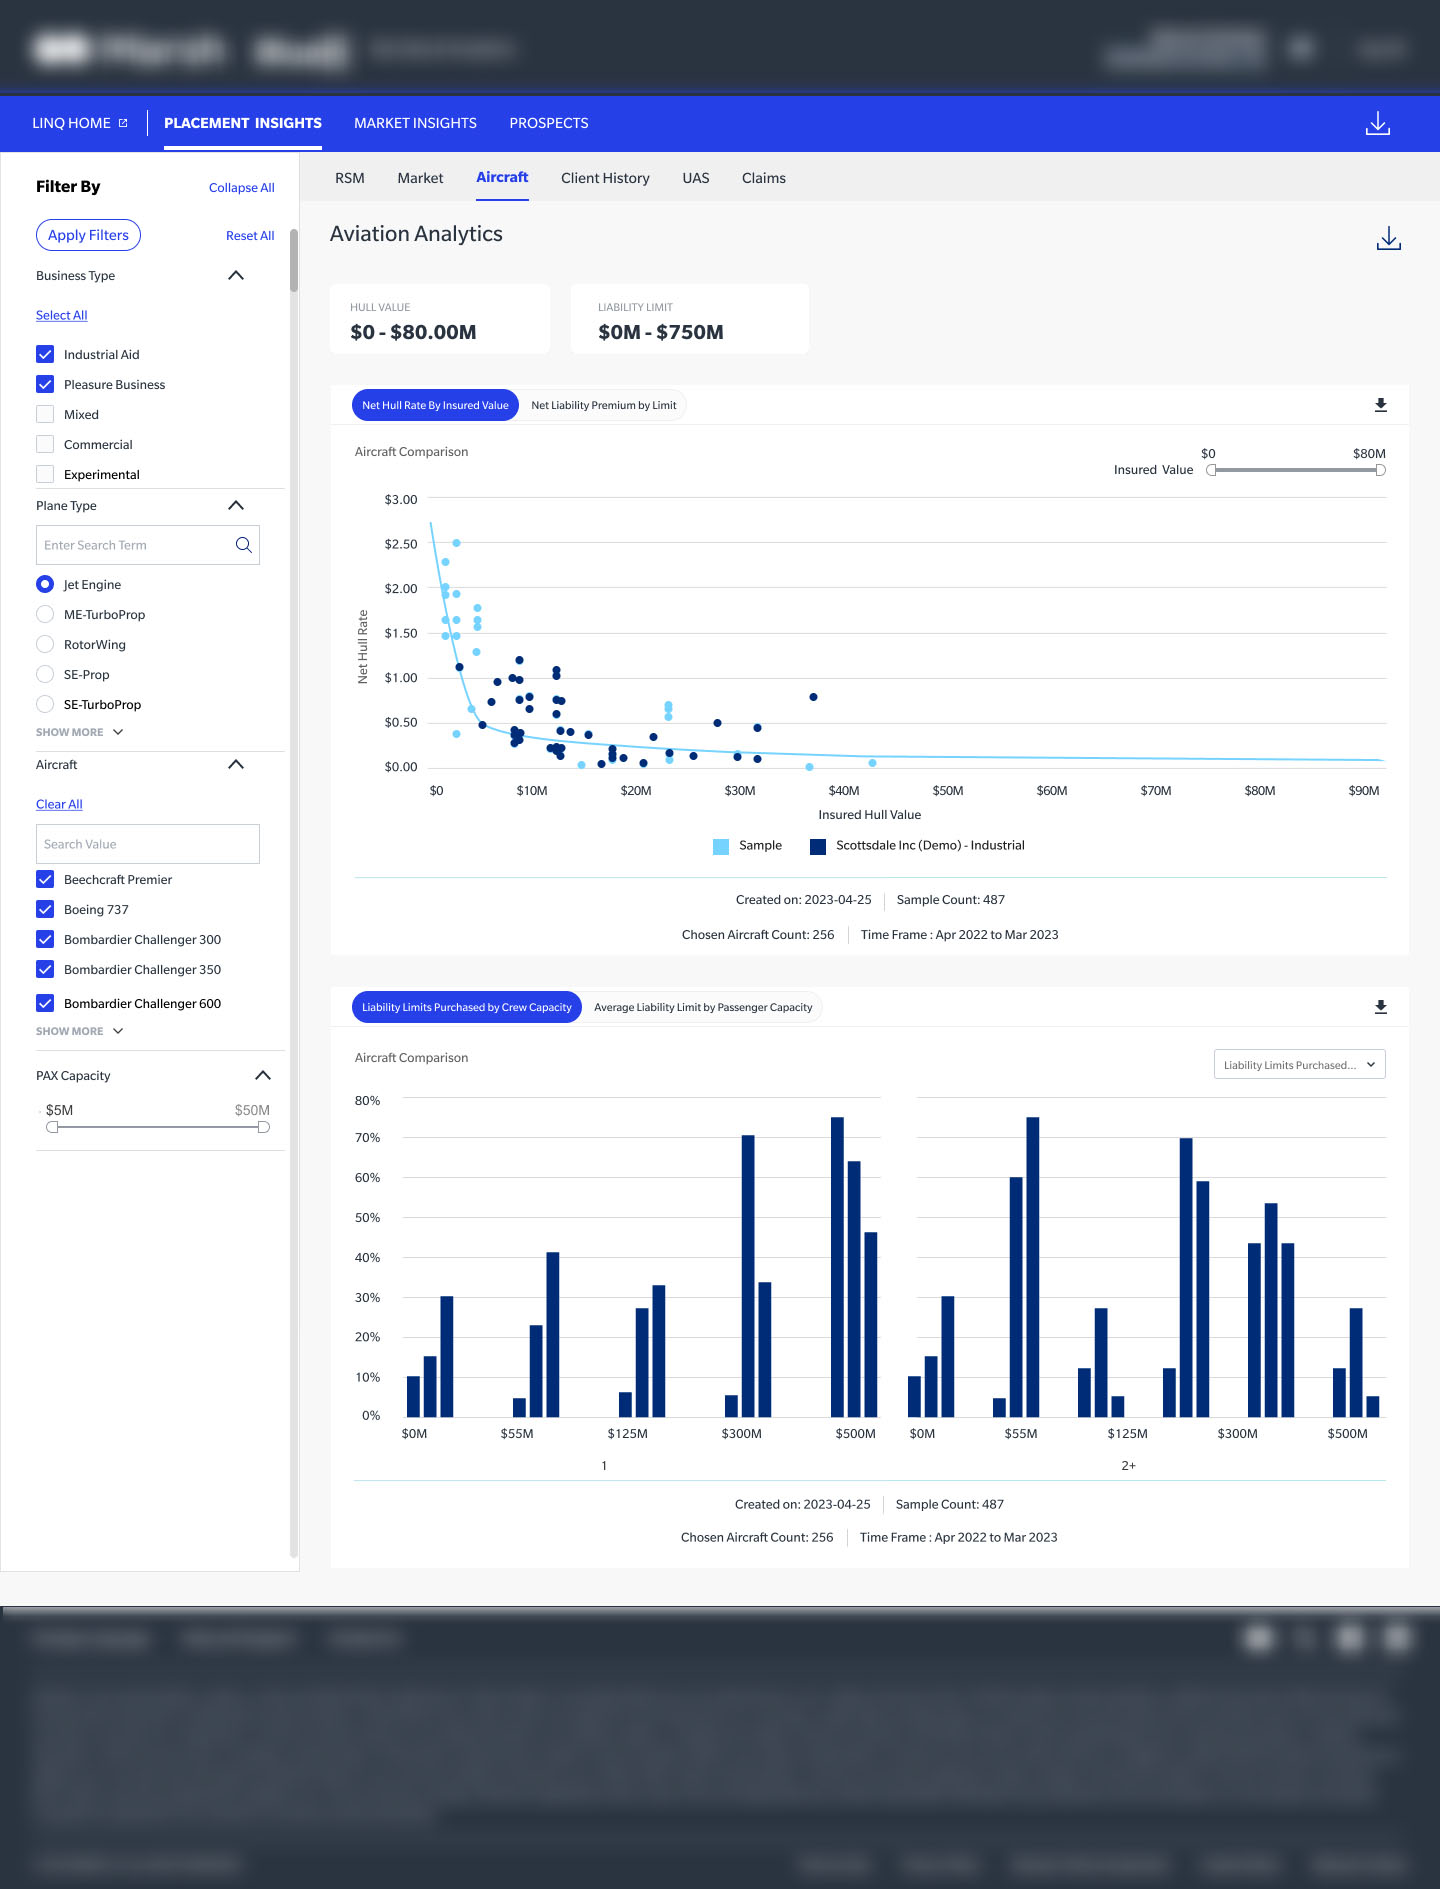
Specialty Claims — Aviation Incidents
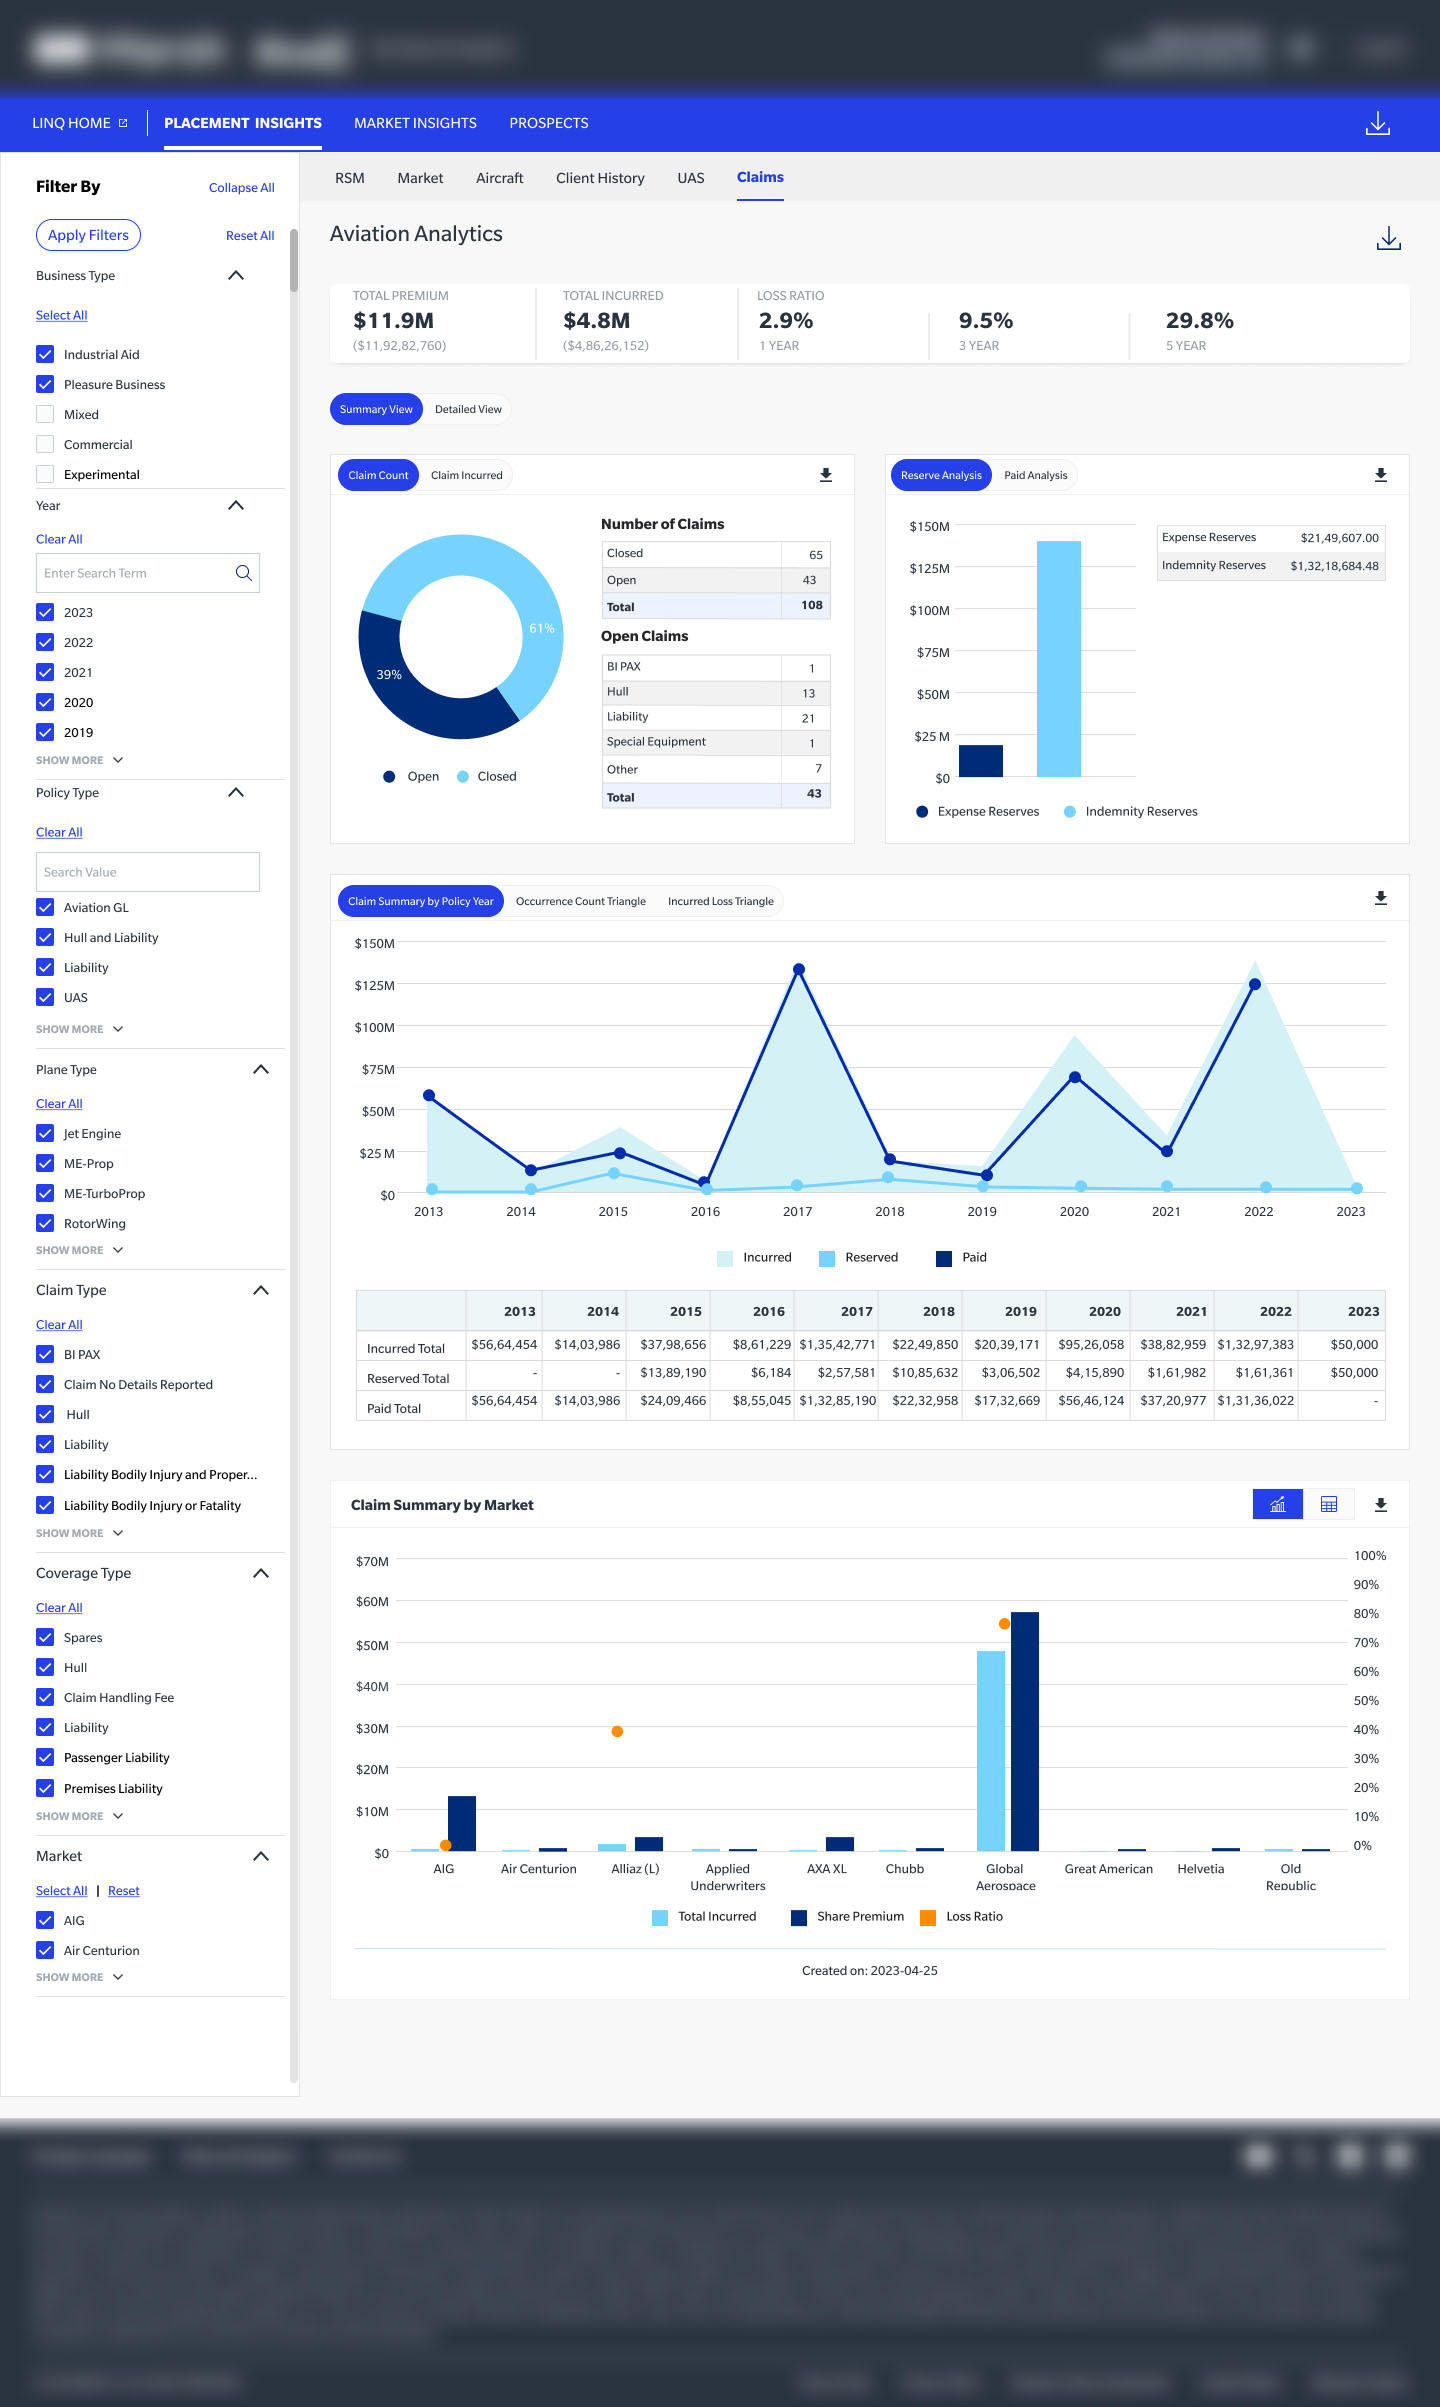
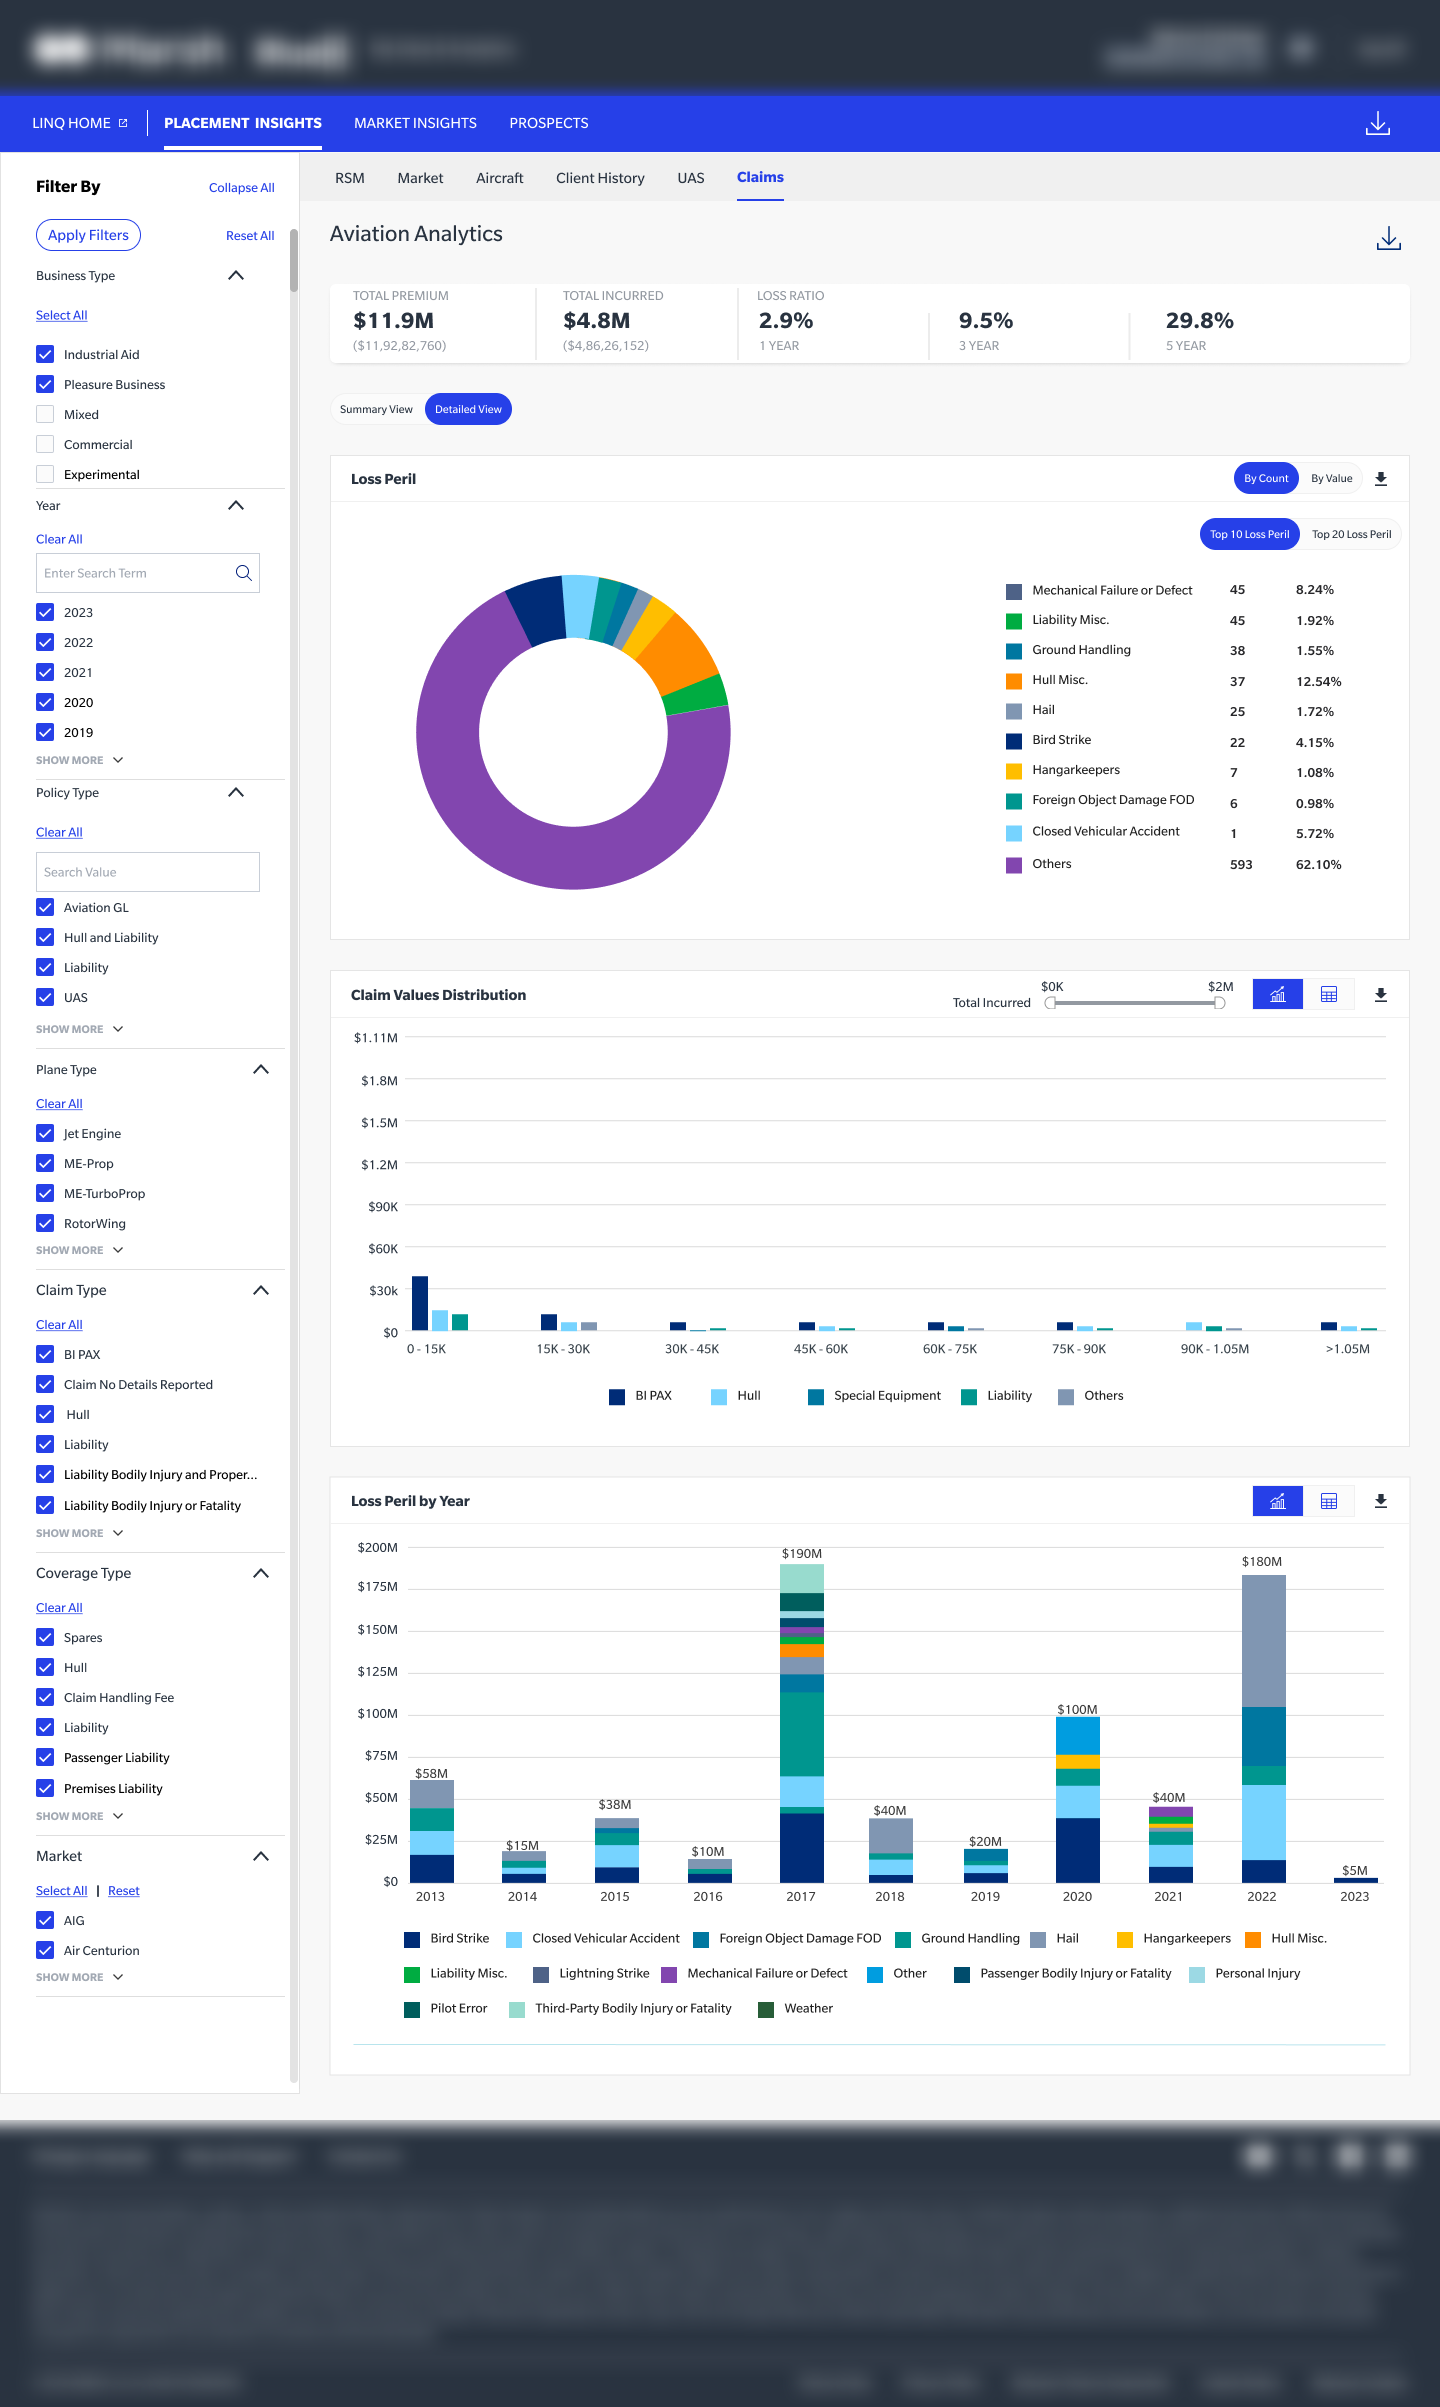
Commercial Claims — Detailed Analysis
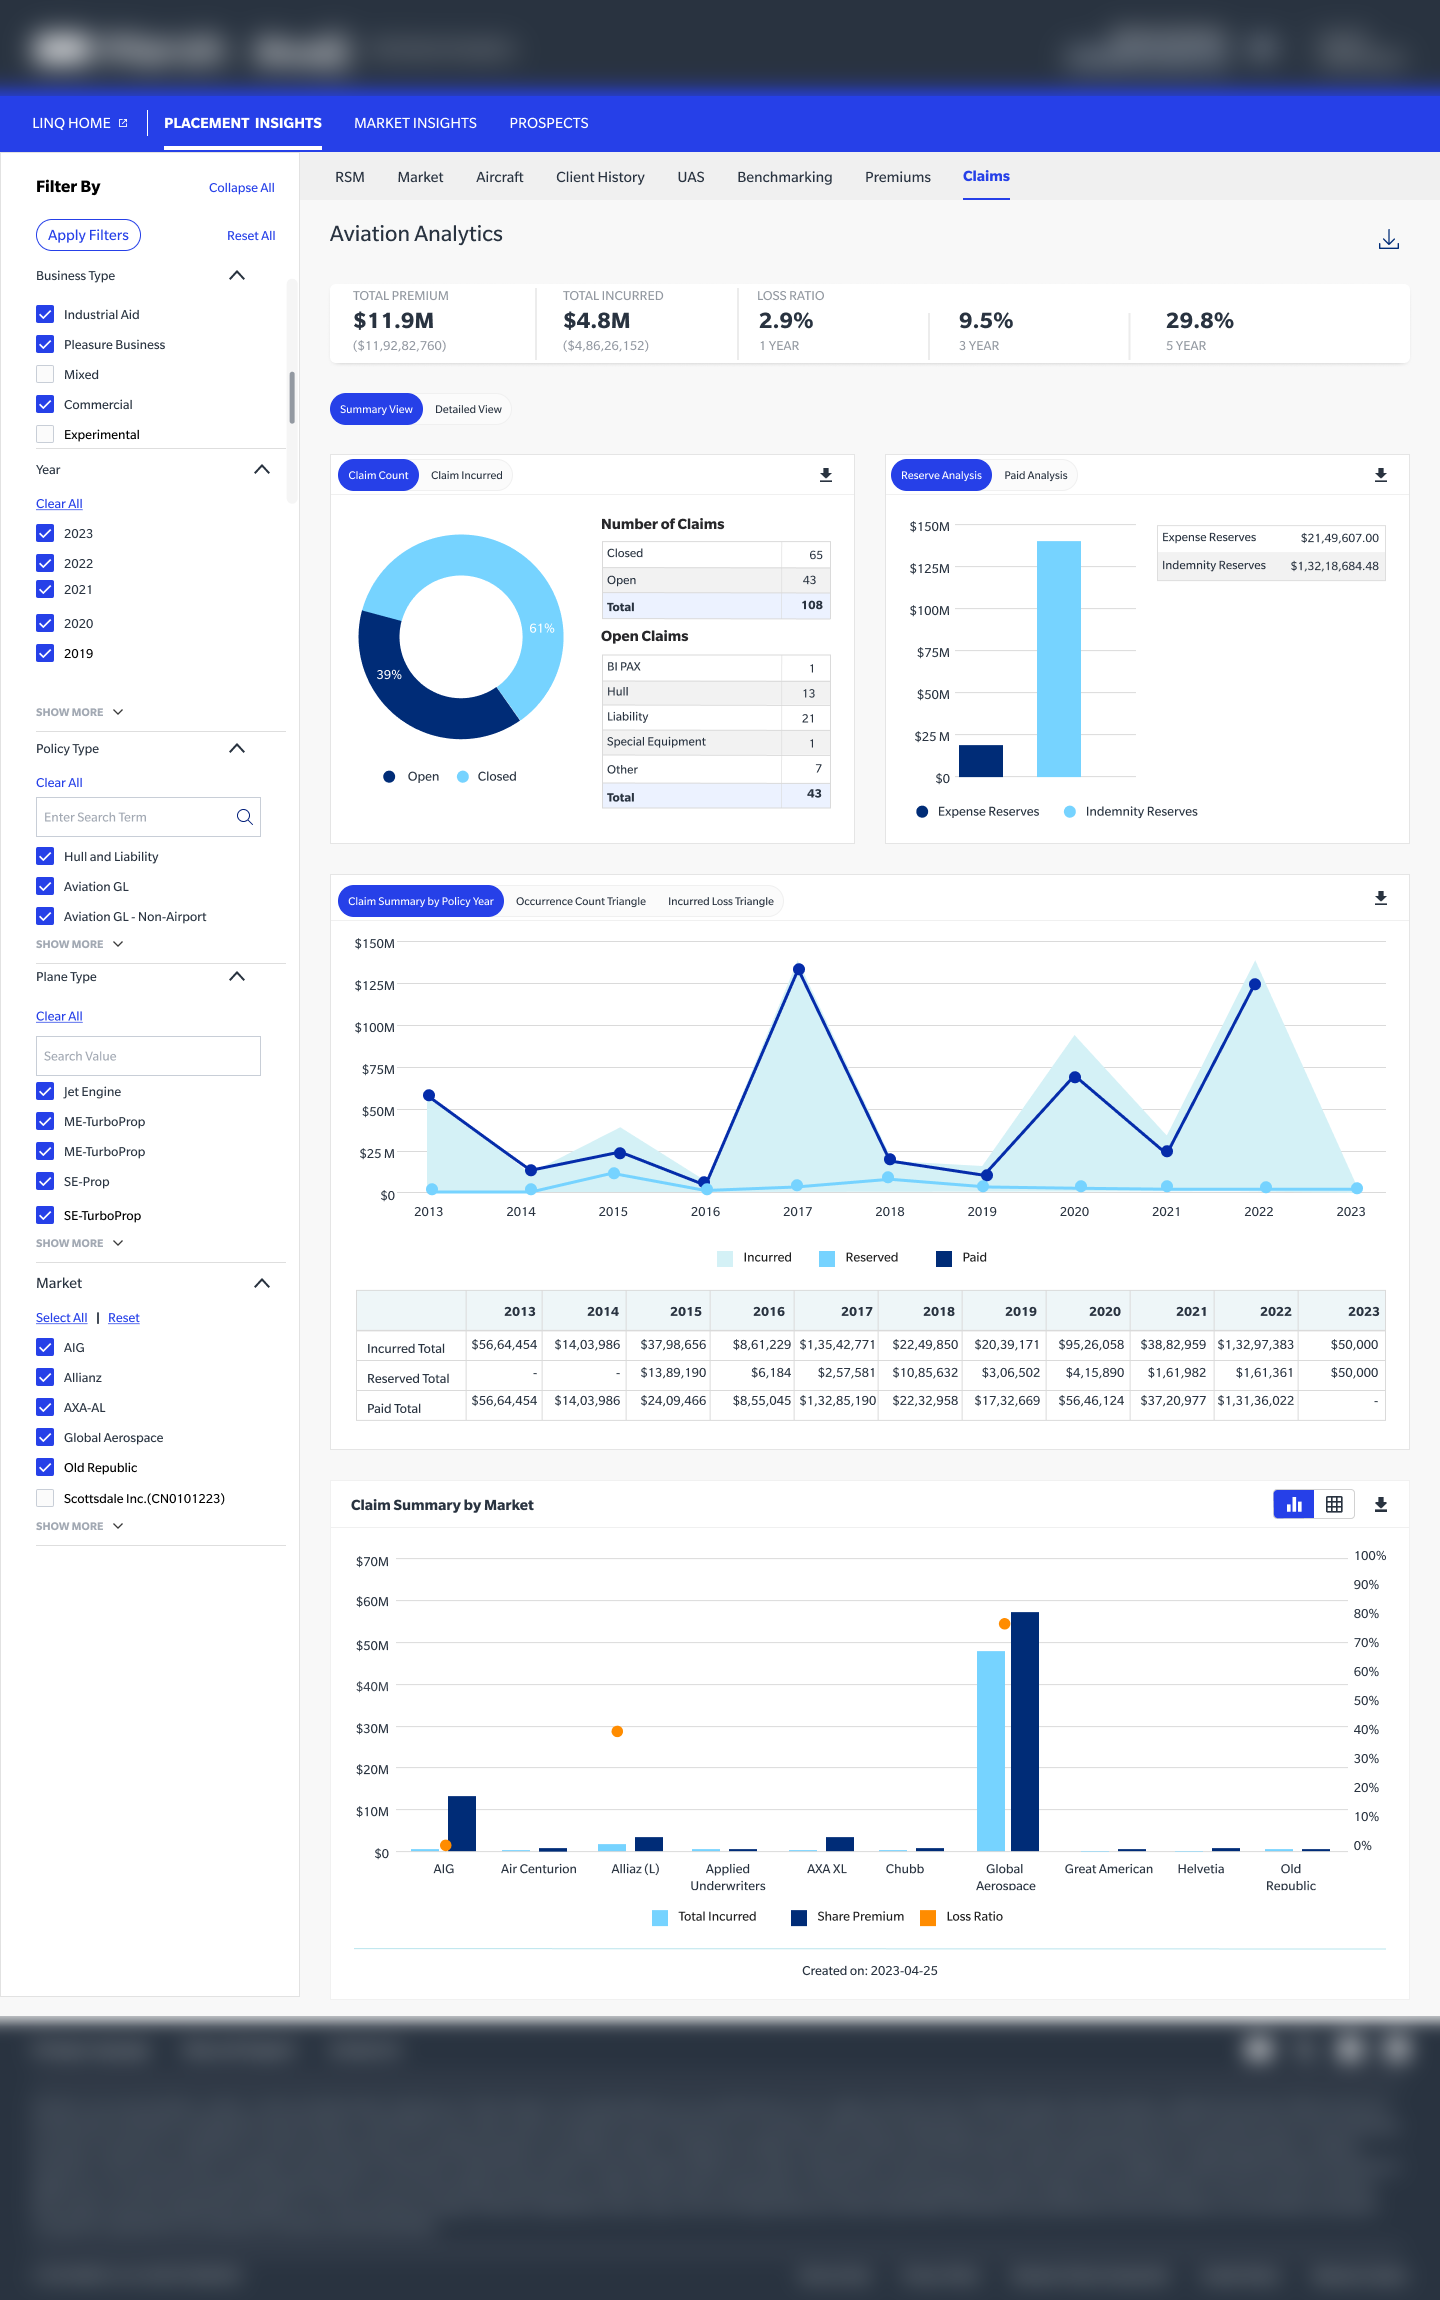
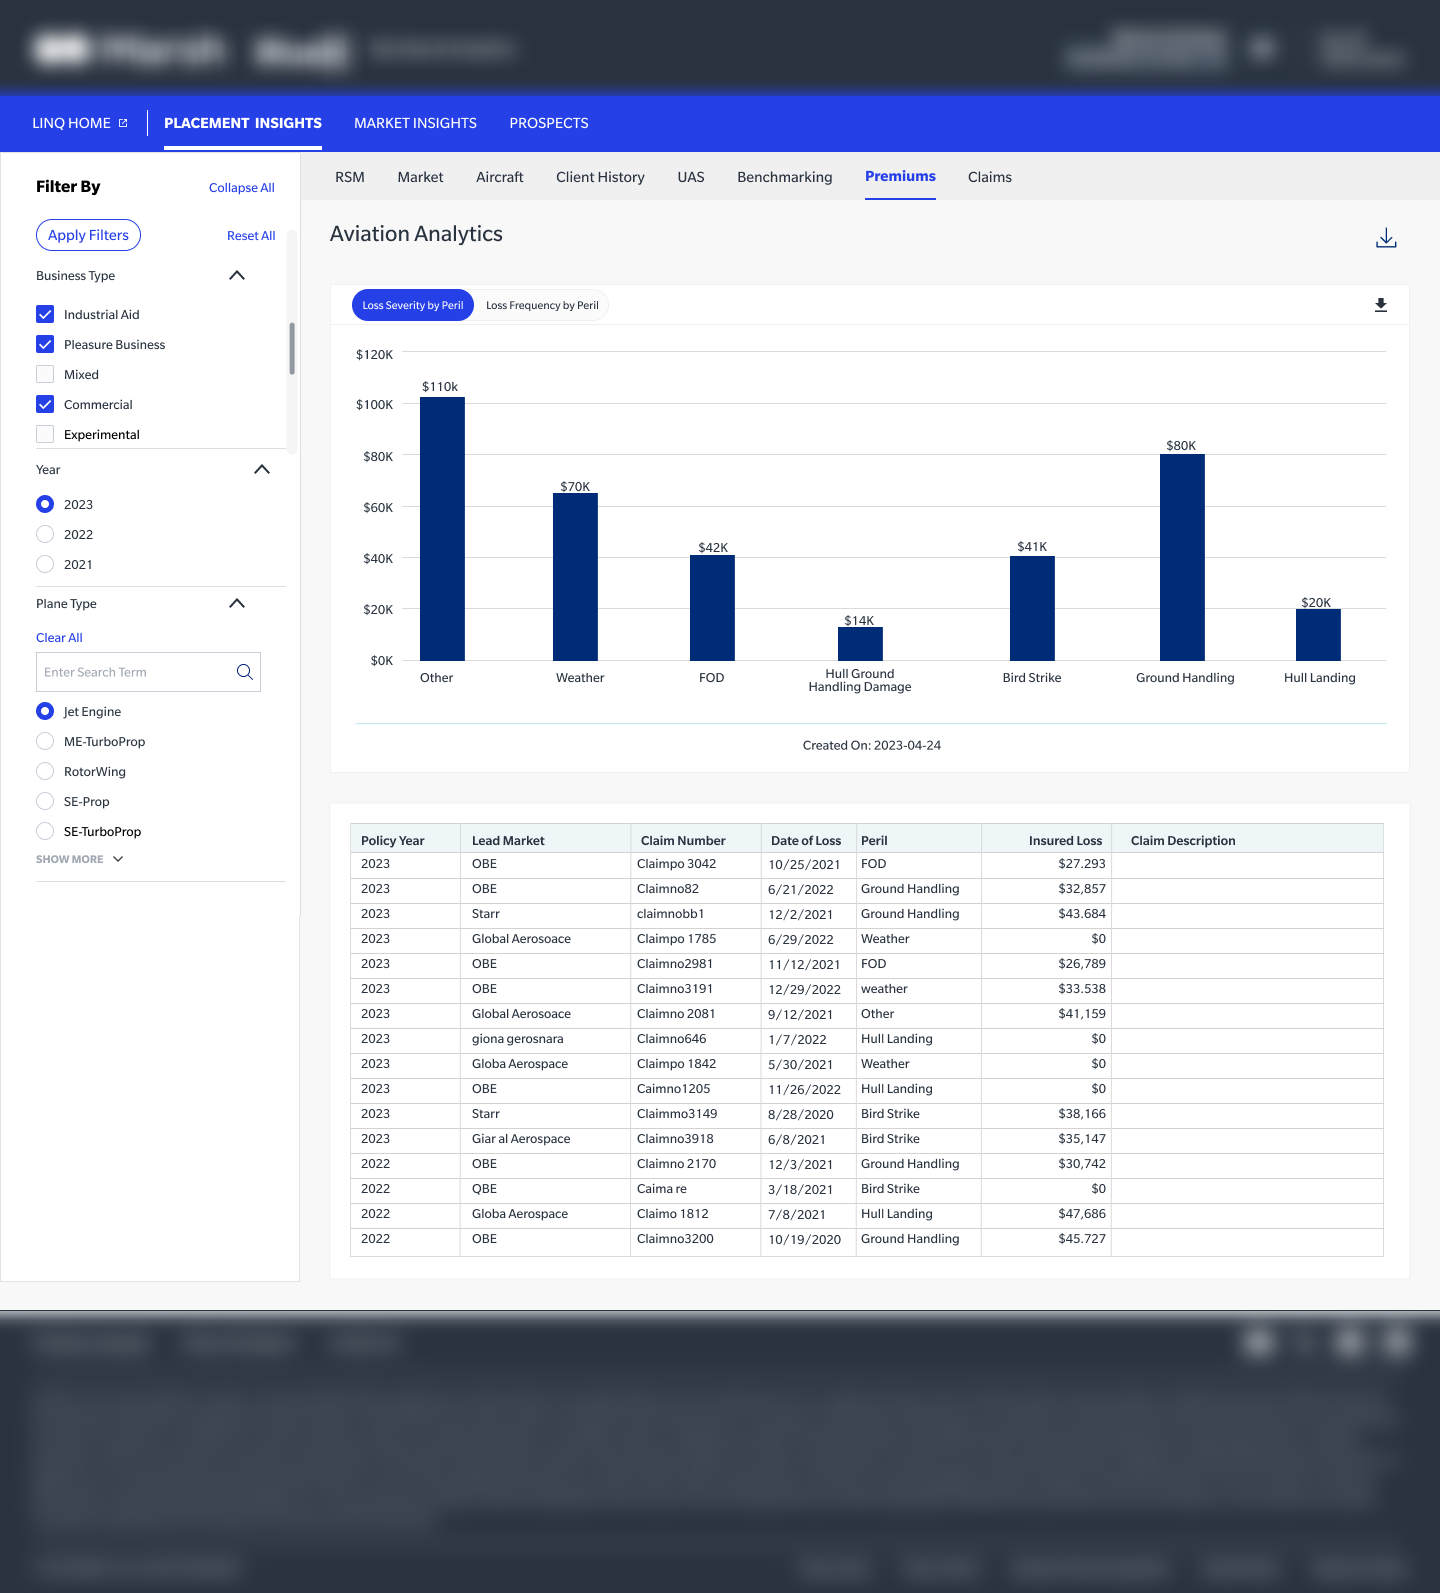
Client History — Longitudinal Trend Analysis
Designing aviation commercial placement analytics module — giving underwriters a unified workspace to benchmark placements, assess fleet risk, analyse market capacity, track UAS exposure, and investigate claims — all within a single, filterable data platform.
Aviation commercial insurance is one of the most data-intensive specialty lines. Underwriters managing large airline and fleet accounts at Marsh needed to benchmark placements against market peers, assess aircraft-level risk signals, monitor UAS (drone) exposure growth, and investigate claims patterns — simultaneously, every renewal cycle.
None of this intelligence existed in one place. Market data came from Lloyd's Intelligence feeds piped into Excel. Aircraft details lived in broker-managed spreadsheets. Claims were reported by email. UAS exposure was tracked in a separate Access database. Underwriters were spending the majority of their time aggregating data rather than making decisions.
"I manage 14 aviation accounts covering over 2,000 aircraft. Pulling together the data for a single renewal takes three days. I should be spending that time on pricing strategy, not spreadsheet assembly."
— Senior Aviation Underwriter, Marsh SpecialtyUnderwriters had no way to compare their placements against market rate curves, liability limit ranges, or peer pricing. Every negotiation was made without comparative intelligence.
Aircraft portfolio data — plane type, insured value, hull rate, liability limit — lived in siloed spreadsheets. There was no unified fleet-level view to identify risk concentration or exposure outliers.
Drone (UAS) exposure was one of the fastest-growing risk classes in aviation, yet it was tracked in a separate database with zero integration to the main underwriting workflow.
I spent four weeks embedded with Marsh's Specialty Aviation team — conducting contextual inquiry sessions with underwriters, claims handlers, and account executives across both commercial and specialty aviation lines. I also ran a competitive teardown of 5 aviation analytics tools, from Willis Towers Watson's Radar Live to bespoke Lloyd's market feeds.
A critical discovery emerged early: aviation underwriters thought in discrete workflow modes — they weren't jumping between data types randomly. They moved systematically: first benchmarking their placement (RSM), then checking market capacity, then drilling into aircraft detail, then reviewing UAS exposure, and finally validating against claims history. This mental workflow became the tab architecture.
Underwriters spent 68% of renewal prep time aggregating data across disparate systems
Business type and plane type filters were the most critical data segmentation dimensions
Scatter plots with peer benchmarks were the single most-requested visualisation format
Claims intelligence was used retroactively — underwriters needed it proactively at renewal
Manages 10-20 commercial fleet accounts. Needs placement benchmarking, aircraft-level risk signals, and market capacity data consolidated in one view. Primary power user — high decision frequency.
Manages aviation incident claims across the portfolio. Needs geographic claims clustering, severity scoring, and timeline tracking — integrated with placement context, not siloed.
Client-facing broker managing the Marsh–airline relationship. Needs self-service fleet reports and benchmark comparisons to present to clients without waiting on internal data requests.
The core design insight: aviation underwriters don't jump between data types randomly — they move sequentially through six decision modes each renewal. We mapped that exact mental workflow into the tab architecture, with a persistent filter panel that carries context across every view.
The six tabs — RSM, Market, Aircraft, Client History, UAS, Claims — map exactly to the sequential mental workflow aviation underwriters follow at renewal. Users never lose context when switching between modes because the persistent filter panel carries across every tab.
Research confirmed that underwriters think in comparative terms — not absolute numbers. Every placement analytics view leads with a peer benchmark scatter plot overlaid with a regression line, so underwriters instantly see where their client sits relative to the market.
Rather than a separate tool, claims intelligence is embedded as the final tab in the renewal workflow — so underwriters check incident history in context of the placement they're currently working on.
Blue[i] Spec-Avi launched to Marsh's Specialty Aviation team in Q1 2023, rolling out across commercial aviation underwriters in the following quarter. The tab-based analytics workspace eliminated the multi-tool data assembly routine that had defined every renewal cycle — replacing it with a single, filterable intelligence platform that matched how underwriters actually think.
Fleet account renewal prep time reduced by 40% — from 3 days to under 2 days average
$12M in placement mispricings and over-coverage identified via benchmarking in year one
5× increase in data sources actively consulted during renewal decisions
87% CSAT across 40+ aviation underwriters in post-launch satisfaction survey
UAS module drove a 32% improvement in drone exposure identification accuracy
3 new aviation accounts won with Spec-Avi's benchmarking reports cited as a differentiator
"Before Spec-Avi, I was pulling six different reports to prepare for a renewal conversation. Now I open one tab. The scatter plot alone saves me half a day — I can see in 30 seconds exactly where my client sits against the market."
— Senior Aviation Underwriter, Marsh Specialty (Post-Launch Interview)The most important design insight was that workflow sequence is information architecture. Underwriters didn't need a configurable dashboard — they needed a structured, sequenced workspace that mirrored their own mental workflow. By mapping tabs directly to the six phases of their renewal decision process, we eliminated navigation friction entirely. Every underwriter knew exactly where to go next, because the tool was built around how they already worked — not around how the data was organised.
I'm open to senior Product/UX Design roles or consulting engagements.